
MAS3301 Bayesian Statistics Problems 3 and Solutions
(f) Plot a graph showing the prior and posterior probability density functions of on the same axes. (g) Find the posterior probability that <0:6: Notes: The probability density function of a beta(a;b) distribution is f(x) = kxa 1(1 x)b 1 where kis a constant. If X˘beta(a;b) then the mean of Xis E(X) = a a+ b and the variance of Xis var(X) = ab
Download MAS3301 Bayesian Statistics Problems 3 and Solutions

Information
Domain:
Source:
Link to this page:
Documents from same domain
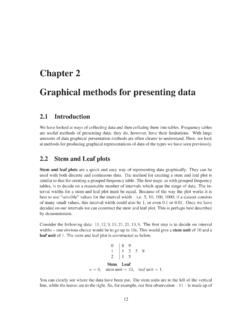
Chapter 2 Graphical methods for presenting data
www.mas.ncl.ac.ukChapter 2 Graphical methods for presenting data 2.1 Introduction We have lookedatways of collectingdataand thencollatingthem intotables. Frequency tables

Analysis of Covariance - Newcastle University
www.mas.ncl.ac.ukMedical Statistics course: MD/PhD students, Faculty of Medicine & MED819: ANCOVA 1 Analysis of Covariance 1. Introduction The Analysis of Covariance (generally known as ANCOVA) is a technique

Data Description, Populations and the Normal …
www.mas.ncl.ac.ukData Description, Populations and the Normal Distribution Introduction This course is about how to analyse data. It is often stressed that it may be totally

Calculating the mean and standard deviation on a calculator
www.mas.ncl.ac.ukMAS1403: Quantitative methods for Business Management Tutorial: Week 3 Calculating the mean and standard deviation on a calculator The following commands show how to calculate the mean and standard deviation by using the STAT

Chapter 6 Using Minitab - ncl.ac.uk
www.mas.ncl.ac.ukChapter 6 Using Minitab ... Programs– Statistical Software– Minitab 16 for Windows– Minitab 16. You should now have a spreadsheet (“data window”) ready to input data. In Minitab, there are two main windows; the Session window and the Worksheet window. The

1 Starting Minitab - Newcastle University
www.mas.ncl.ac.ukStart > All Programs > Minitab > Minitab 16 Statistical Software You will see two windows: a session window and a worksheet. Data are entered into columns labelled C1, C2, C3, etc in the worksheet. 2 Stem and leaf plots Suppose C1contains some data. To obtain a stem and leaf plot of these data you would need to do

Chapter 8 More Discrete Probability Models
www.mas.ncl.ac.ukCHAPTER 8. MORE DISCRETE PROBABILITY MODELS 82 of sixes on the 3 rolls, we have that X has a binomial distribution with parameters n = 3 and p = 1/6, that is

1 Starting Minitab - Newcastle University
www.mas.ncl.ac.ukMAS1403: Quantitative Methods for Business Management Minitab supplement 6 Cumulative Frequency Polygons (Ogive) This graph can be produced using the following Minitabinstructions: 1. In column C1, enter the end points of the class intervals, as well as the starting point of the smallest class. 2.

Calculation of Positive Predictive Value
www.mas.ncl.ac.ukCalculation of Positive Predictive Value The positive predictive value (PPV) is the probability that an individual with a positive screening result (denoted +) has the disease (denoted D). The sensitivity is the probability that an individual with the disease is screened positive and the specificity is the probability that an
Related documents

Kentucky Academic Standards Mathematics
education.ky.govThe Mathematics Advisory Panel was composed of twenty-four teachers, three public post- secondary professors from institutions of higher education and two community members. The function of the Advisory Panel was to review the standards and make recommendations for changes to a Review Development Committee.

Introduction to Modern Cryptography
web.cs.ucdavis.eduretains some of this flavor, the last twenty-five years have brought in something new. The art of cryptography has now been supplemented with a legitimate science. In this course we shall focus on that science, which is modern cryptography. Modern cryptography is a remarkable discipline. It is a cornerstone of computer and communi-
Assessment For The California Mathematics Standards Grade 1
www.csun.eduStatistics, Data Analysis and Probability S 1.1 21. This graph shows how many sad faces there are. Draw a bar on the graph to show how many happy faces there are: FACES 4 3 …

160 Customers/8 hours 20 Customers/hour
cob.jmu.eduPn = Probability of having n units in the system (in queue plus being served) 12. C N7`e —9s! Xo1 1. c2, • • T 1 Queuing (Waiting Line) Theory and Applications Queuing Problems (Class hand out) Suppose that customers arrive about every 3 minutes on average to JMU Bookstore according to a Poisson process.

What Is a Standards-Based Curriculum?
mcc.edc.orgthe twenty-first century. Big Ideas ÒBig ideasÓ in mathematics are those ideas and principles that govern the structure and functioning of the mathematical system. When students understand these Òbig ideas,Ó they have the conceptual tools to approach and solve many different kinds of …

Dropout Prevention: Recommendations for School …
files.eric.ed.gova 75 % probability of dropping out of school (National High School Center, 2007). Finn (1989) indicated that performing poorly over school one year may lead to temporary disappointment causing students to continue to perform poorly over several years, leading to students becoming detached from school and internalizing the notion that

HCR-20 & Violence Risk Assessment”
nasmhpd.org1. Overview of SPJ and HCR-20 2. Research Summary of SPJ and HCR-20 3. Revision of HCR-20 – Introduction to HCR:V3
Government Debt - Harvard University
scholar.harvard.edutwenty-first century. Section II then examines the conventional view of the effects of ... Other valuation problems are more conceptual. Do the future Social ... believe that these benefits will be paid with the same probability that the explicit debt will be honored, then it may be sensible to count the present

1 Basic ANOVA concepts - Calvin University
sites.calvin.eduthe table are the F values, and the P-values (the probability of getting an F statistic larger than that if the null hypothesis is true) are down the left side. Example: Determine P(F3,6 > 9.78)= 0.01 P(F2,20 > 5)= between 0.01 and 0.025 Example: A rm wishes to compare four programs for training workers to perform a certain manual task.