
MINITAB Tutorial - GitHub Pages
Time Series Forecasting 1. MINITAB Windows Environment Upon entering into a MINITAB session, you will see a screen similar to Figure 1. The bottom portion of the screen is an empty spreadsheet—called a MINITAB worksheet—with columns representing variables and rows representing observa-tions (or cases).
Download MINITAB Tutorial - GitHub Pages

Information
Domain:
Source:
Link to this page:
Related documents
FORECASTING - University of North Carolina Wilmington
csbapp.uncw.eduForecasting Approaches Qualitative •Used when situation is vague & little data exist • New products • New technology •Involves intuition, experience • e.g., forecasting sales on Internet Quantitative •Used when situation is ‘stable’ & historical data exist • Existing products • Current technology •Involves mathematical ...

Quantitative Methods for Business and Management
www.mim.ac.mwQuantitative methods use quantitative data which consists of measurements of various kinds. Quantitative data may be measured in one of four measurement scales, and it is important to be aware of the measurement scale that applies to your data before commencing any data description or analysis. The four measurement scales are: (a) Nominal Scale

A STEP-BY-STEP GUIDE TO THE BLACK-LITTERMAN MODEL ...
faculty.fuqua.duke.edubeyond quantitative managers. Introduction The Black-Litterman asset allocation model, created by Fischer Black and Robert Litterman, is a sophisticated portfolio construction method that overcomes the problem of unintuitive, highly-concentrated portfolios, input-sensitivity, and estimation error

Revenue and expenditure forecasting techniques for a PER ...
www.cepal.org2 The Nature and Process of Revenue Forecasting Accurate forecasting of revenues and expenditures is important for avoiding both underfunding and excessive funding of the government, and related consequences of associated surpluses or deficits. Forecasting uses available data and methods of analysis to estimate the value of a
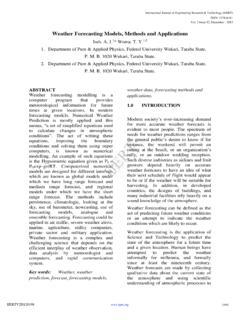
Weather Forecasting Models, Methods and Applications
www.ijert.orgforecasting relies heavily on numerical weather prediction. According to Lutgens and TarBuck (1989), the word “numerical” is misleading, for all types of weather forecasting are based on some quantitative data and therefore could fit under this heading. Numerical weather prediction is based on the fact that the

SKILLS INVENTORY - San Jose State University
www.sjsu.eduSkills can be developed and applied to all aspects of our lives including education, internships, volunteering, jobs, careers, and leisure activities.

Managerial Economics - Tutorialspoint
www.tutorialspoint.comDemand analysis and forecasting involves huge amount of decision making! Demand estimation is an integral part of decision making, an assessment of future sales helps in strengthening the market position and maximizing profit. In managerial economics, demand analysis and forecasting holds a very important place. Profit Management