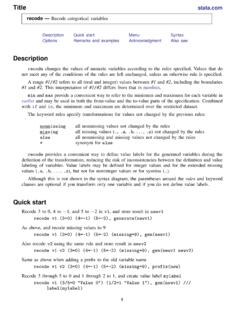
Recode categorical variables - Stata
value labels on these new variables. It is possible to do this in three steps: 1. Create the new variables (recode :::, gen()). 2. Define the value label (label define :::). 3. Link the value label to the variables (label value :::). Inconsistencies may emerge from mistakes between steps 1 and 2. Especially when you make
Download Recode categorical variables - Stata

Information
Domain:
Source:
Link to this page:
Documents from same domain

Syntax - Stata
www.stata.com2cluster kmeans and kmedians— Kmeans and kmedians cluster analysis Options Main k(#) is required and indicates that # groups are to be formed by the cluster analysis.

Syntax Description - Stata
www.stata.com2substr()— Extract substring Diagnostics In substr(s, b, l) and substr(s, b), if b describes a position before the beginning of the string or after the end, "" is returned.

Title stata.com generate — Create or change …
www.stata.comTitle stata.com generate — Create or change contents of variable SyntaxMenuDescriptionOptions Remarks and examplesMethods and formulasReferencesAlso see Syntax Create new variable generate type newvar

SyntaxDescriptionRemarks and examplesAlso see
www.stata.commacro— Macro definition and manipulation 3 Macro extended functions related to matrices rownamesjcolnamesjrowfullnamesjcolfullnames matname roweqjcoleq

Title stata.com graph box — Box plots
www.stata.comgraph box— Box plots 3 Menu Graphics > Box plot Syntax graph box yvars if in weight, options graph hbox yvars if in weight, options where yvars is a varlist options Description

Title stata
www.stata.comarea options — Options for specifying the look of special areas 3 Also see [G-2] graph dot — Dot charts (summary statistics)

www.stata.com
www.stata.com2cluster dendrogram— Dendrograms for hierarchical cluster analysis The height of the vertical lines and the range of the (dis)similarity axis give visual clues about the

Title stata.com putexcel — Export results to an Excel …
www.stata.computexcel— Export results to an Excel file 3 export options Description Main overwritefmt overwrite existing cell formatting when exporting new content

destring — Convert string variables to numeric ... - …
www.stata.comTitle stata.com destring — Convert string variables to numeric variables and vice versa SyntaxMenuDescription Options for destringOptions for tostringRemarks and …

Title stata.com gettoken — Low-level parsing
www.stata.comTitle stata.com gettoken — Low-level parsing SyntaxDescriptionOptionsRemarks and examplesAlso see Syntax gettoken emname1 emname2: emname3, parse("pchars") quotes qed(lmacname) match(lmacname) bind
Related documents
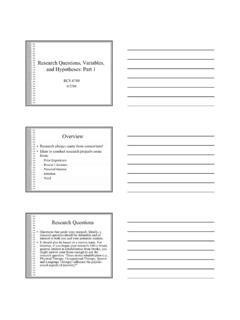
Research Questions, Variables, and Hypotheses: Part 1
courses.phhp.ufl.edudifference between variables and values of variables. Many individuals will incorrectly define a value of a variable as the variable. • Following are some examples of variables and some of there potential values. 4 Variables and Variable Values Variables • Types of Beer ro l Cor i•Ha
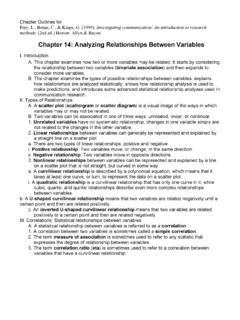
Chapter 14: Analyzing Relationships Between Variables
mason.gmu.eduB. To determine the statistical correlation between two variables, researchers calculate a correlation coefficient and a coefficient of determination. 1. Correlation coefficient: A correlation coefficient is a numerical summary of the type and strength of a relationship between variables.

IDENTIFYING VARIABLES, RESEARCH PURPOSES AND …
people.uncw.eduWhat is the relationship between the variation in X and the variation in Y? What differences in X account for the variation in Y? These are your RESEARCH PURPOSES. EXAMPLE--IDENTIFYING VARIABLES AND RESEARCH PURPOSES TOPIC: Student - Teacher relationships Observe teachers changing students' grades from 78 to 90, 72 to 80, and 88 to 93.
Correlation Between Continuous & Categorical Variables
www.ce.memphis.edu3 Association between Continuous Variables •Compute Pearson’s correlation coefficient (r) – r<0.3, weak correlation – 0.3<r<0.7, moderate correlation
Describing Relationships between Two Variables
www.stat.ucla.eduDescribing Relationships between Two Variables Up until now, we have dealt, for the most part, with just one variable at a time. This variable, when measured on many different subjects or objects, took the form of a list of numbers. The descriptive techniques we discussed were useful for describing such a list, but more often,

Association between Two or More Variables - SSRIC
ssric.orgAssociation between Two or More Variables Very frequently social scientists want to determine the strength of the association of two or more variables. For example, one might want to know if greater population size is associated with higher crime rates or whether there are any differences between numbers employed by sex and race.

Part 2: Analysis of Relationship Between Two Variables
www.ess.uci.eduThe relation between the scatter to the line of regression in the analysis of two variables is like the relation between the standard deviation to the mean in the analysis of one variable. If lines are drawn parallel to the line of regression at distances equal to ± (S scatter)0.5 above and below the line, measured in the y
Chapter 15 Mixed Models - Carnegie Mellon University
www.stat.cmu.edurelationship between the quantitative variables trial and score. But ANCOVA assumes that all of the measurements for a given age group category have uncor-related errors. In the current problem each subject has several measurements and