S&P 500 Financial Ratios - Yardeni Research
Corporate Finance Briefing: S&P 500 Financial Ratios Yardeni Research, Inc. August 11, 2019 Dr. Ed Yardeni 516-972-7683 [email protected] Joe Abbott
Download S&P 500 Financial Ratios - Yardeni Research
Information
Domain:
Source:
Link to this page:
Documents from same domain
Stock Market Sentiment & Technical Indicators
www.yardeni.comTable Of Contents Table Of ContentsTable Of Contents August 9, 2018 / Stock Market Sentiment & Technical Indicators www.yardeni.com Yardeni Research, Inc. Fundamental Stock Market Indicator 1-2
Stock Market Sentiment & Technical Indicators
www.yardeni.comTable Of Contents Table Of ContentsTable Of Contents July 26, 2018 / Stock Market Sentiment & Technical Indicators www.yardeni.com Yardeni Research, Inc. Fundamental Stock Market Indicator 1-2 Global Growth Barometer 3
YRI S&P 500 Earnings Forecast - Yardeni Research
www.yardeni.comYRI S&P 500 Earnings Forecast Yardeni Research, Inc. August 13, 2018 Dr. Ed Yardeni 516-972-7683 [email protected] Joe Abbott 732-497-5306 [email protected]
Stock Market Briefing: S&P 500 Sectors & Industries ...
www.yardeni.comStock Market Briefing: S&P 500 Sectors & Industries Forward P/Es Yardeni Research, Inc. August 15, 2018 Dr. Edward Yardeni 516-972-7683 [email protected]

Money & Credit: US Quarterly Banking Profile (FDIC)
www.yardeni.comMoney & Credit: US Quarterly Banking Profile (FDIC) Yardeni Research, Inc. May 1, 2017 Dr. Edward Yardeni 516-972-7683 [email protected] Mali Quintana
Stock Market Indicators: Bull/Bear Ratios - Yardeni Research
www.yardeni.comTable Of Contents Table Of ContentsTable Of Contents November 14, 2018 / Stock Market Indicators: Bull/Bear Ratios www.yardeni.com Yardeni Research, Inc. Bulls & Bears 1 Bull/Bear Ratio Over 3.0 2 Bull/Bear Ratio Under 1.0 3
US Economic Indicators: Capital Spending During Expansions
www.yardeni.comSource: Bureau of Economic Analysis. yardeni.com Figure 2. Capital Spending Page 1 / November 10, 2018 / US Economic Indicators: Capital Spending During Expansions ... Page 9 / November 10, 2018 / US Economic Indicators: Capital Spending During Expansions www.yardeni.com
Stock Market Indicators: Bull/Bear Ratios
www.yardeni.comTable Of Contents Table Of ContentsTable Of Contents November 14, 2018 / Stock Market Indicators: Bull/Bear Ratios www.yardeni.com Yardeni Research, Inc. Bulls & Bears 1 Bull/Bear Ratio Over 3.0 2 Bull/Bear Ratio Under 1.0 3
S&P 500/400/600 Weekly Fundamentals
www.yardeni.comStock Market Briefing: S&P 500/400/600 Weekly Fundamentals Yardeni Research, Inc. January 18, 2019 Dr. Edward Yardeni 516-972-7683 [email protected]

Global Index Briefing: MSCI Forward P/Es - Yardeni Research
www.yardeni.comTable Of Contents Table Of ContentsTable Of Contents February 27, 2019 / Global Index Briefing: MSCI Forward P/Es www.yardeni.com Yardeni Research, Inc. Major Regions 3-4 Advanced Economies 5-6 Major Europe Economies 7
Related documents
Reportable HMDA Data: A Regulatory and Reporting …
files.consumerfinance.govThis chart is intended to be used as a reference tool for data points required to be collected, recorded, and reported under Regulation C, as amended by the HMDA Rule s issued on October 15, 2015, aon August 24, 2017, on October 10, 2019, and on April 16, 2020. Relevant regulation and commentary sections are provided for ease of reference.
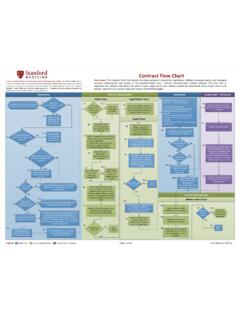
Contract Flow Chart - Stanford Health Care
stanfordhealthcare.orgtax) for Stanford Health Care, or Two Thousand Five Hundred Dollars ($2,500.00) or more for Lucile Salter Packard hildren’s Hospital at Stanford; and 2. The depreciable life is over two (2) years. Step 3. a. If the purchase is $75,000.00 or more, identify 1) if the purchase is governed by an existing contract, 2)
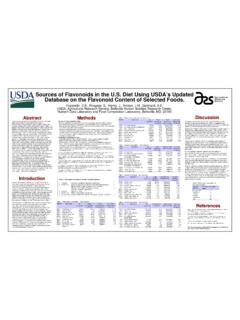
Sources of Flavonoids in the U.S. Diet Using USDA’s Updated
www.ars.usda.govTechnology Abstracts) were searched using key words for flavonoids. One hundred and two relevant articles containing analytical data on 26 compounds in edible foods published from 2002 to 2005 were retrieved and added to the 97 articles used in the first release of the database for a total of 199. Calculation of consumption data:

Employer-Reported Workplace Injuries and Illnesses – 2020
www.bls.govChart 3 . Incidence rates for cases resulting in days away from work in selected occupations, private industry, 201 9-20 . Occupation . Ten occupations accounted for 38 .3 percent of all private industry cases involving days away from work (DAFW) in 2020. Of these, nursing assistants had the highest number of DAFW cases with 96,480 , an

THE PSYCHROMETRIC CHART AND ITS USE - RSES
www.rses.orgTHE PSYCHROMETRIC CHART AND ITS USE Psychrometry is an impressive word which is defined as the measurement of the moisture content of air. In broader terms it is the science and practices associated with atmospheric air mixtures, their control, and the effect on materials and human comfort.

Converting Times from 12-hour clock to 24-Hour clock
www.spps.orgIn 24-hour (military) time, 12:00am is equal to 0000 and is read as “0 hundred hours”. 1:00am, or 0100, is pronounced as “zero 1 hundred hours”. The rest of the hours between 12:00 AM and noon on the 12-hour clock are equal to the hours between 0000hrs and 1200hrs. This means that 12:00am = 0000hrs, 1:00am = 0100hrs, etc.