
Statistics 502 Lecture Notes
CONTENTS iii 7 Nested Designs 163 7.1 Mixed-e ects approach . . . . . . . . . . . . . . . . . . . . . .171 7.2 Repeated measures analysis ...
Download Statistics 502 Lecture Notes

Information
Domain:
Source:
Link to this page:
Documents from same domain

TIME SERIES MODELLING, INFERENCE AND …
www2.stat.duke.eduTIME SERIES MODELLING, INFERENCE AND FORECASTING ... A time series process is a stochastic process or a collection of random variables yt indexed in time. Note that yt will be used throughoutthe book to denote a random variable or an actual realisation of the time series process at time t. We use the

www2.stat.duke.edu
www2.stat.duke.eduRyan Tibshirani Data Mining: 36-462/36-662 January 22 2013 Optional reading: ESL 1410 . Information retrieval with the web information retrieval learned how to compute similarity Last time: scores (distances) of documents to a given query string But what if documents are webpages,

Chapter 3 - continued Chapter 3 sections
www2.stat.duke.eduChapter 3 - continued Chapter 3 sections ... We have the law of total probability for random variables (Theorem 3.6.3 in the book) We also have Bayes’ theorem for random variables (Theorem ... Chapter 3 - continued 3.7 Multivariate Distributions Multivariate Distributions - extension of bivariate ...
Hypothesis Testing - Duke University
www2.stat.duke.eduNull hypothesis: No difference in average fat lost in population for two methods. Population mean difference is zero. Alternative hypothesis: There is a difference in average fat lost in population for two methods. Population mean difference is not …

General Bivariate Normal - Duke University
www2.stat.duke.edu6.5 Conditional Distributions Multivariate Normal Distribution Matrix notation allows us to easily express the density of the multivariate normal distribution for an arbitrary number of dimensions. We express the k-dimensional multivariate normal distribution as follows, X ˘N k( ; There is a similar method for the multivariate normal ...

Multivariable Calculus - Duke University
www2.stat.duke.eduplanes and trajectories. Chapter 5 uses the results of the three chapters preceding it to prove the Inverse Function Theorem, then the Implicit Function Theorem as a corollary, and finally the Lagrange Multiplier Criterion as a consequence of the Implicit Function Theorem. Lagrange multipliers help with a type of multivariable
Convergence in Distribution Central Limit Theorem
www2.stat.duke.eduCentral Limit Theorem Theorem. [Central Limit Theorem (CLT)] Let X1;X2;X3;::: be a sequence of independent RVs having mean „ and variance ¾2 and a common distribution function F(x) and moment generating function M(t) deflned in a neighbourhood of zero. Let Sn = Xn i=1 Xn Then lim n!1 P • Sn ¡n„ ¾ p n • x ‚ = '(x) That is Sn ¡n ...
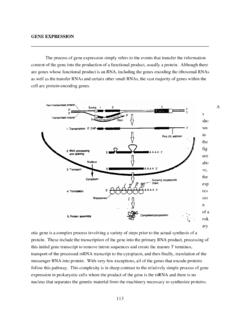
GENE EXPRESSION - Duke University
www2.stat.duke.educlasses of genes most clearly is the complexity of regulatory elements and factors necessary for the transcription of the mRNA genes. As stated before, transcription factors possess two essential properties - the ability to ... functional domains of a yeast transcription factor have been separated in two vectors. Sequences

Tree Based Methods: Regression Trees
www2.stat.duke.eduBasicsofDecision(Predictions)Trees I Thegeneralideaisthatwewillsegmentthepredictorspace intoanumberofsimpleregions. I Inordertomakeapredictionforagivenobservation,we ...
Lecture 20 - Logistic Regression - Duke University
www2.stat.duke.eduIt seems clear that both age and gender have an e ect on someone’s survival, how do we come up with a model that will let us explore this relationship? Even if we set Died to 0 and Survived to 1, this isn’t something we can transform our way out of - we need something more. One way to think about the problem - we can treat Survived and Died as
Related documents
Pretest-posttest designs and measurement of change
cehd.gmu.eduRepeated measures ANOVA with pretest-posttest data Repeated measures ANOVA is used with pretest-posttest data as a mixed (split-plot) factorial design with one between-subjects factor (the grouping vari-162 20,. p.,..,, and measurement, = +,, Change, 165 Measurement ...
Sample Size Calculation - University of North Dakota
med.und.edu9 Repeated Measures ANOVA 1 1 >2 1 Yes Yes 10 Friedman Test 1 1 >2 1 No Yes 11 Multi-way ANOVA (1 Category of interest) 1 ≥2 ≥2 1 Yes No 12 Multi-way ANOVA (>1 Category of interest) 1 ≥2 ≥2 >1 Yes No 13 Proportions Test 0 1 2 1 N/A N/A 14 Fisher’s Exact Test 0 2 2 2 N/A No

Mixed Model Repeated Measures (MMRM)
www.lexjansen.comSSE for the repeated measures ANOVA is 6.833+5.333=12.167 based on 6+6=12 degrees of freedom. Similarly, the SS(Patient) can added to obtain the SS(Patient(Vaccine)) for the repeated measures ANOVA, 11.667+13.667=25.333 with 3+3=6 degrees of freedom. Notice that the sums of squares for the time effect (SS(Visit)) are not additive. Solution

repeated-measures within-participants - Open University
www.open.ac.ukOne-Way Repeated-Measures ANOVA Analysis of Variance (ANOVA) is a common and robust statistical test that you can use to compare the mean scores collected from different conditions or groups in an experiment. There are many different types of ANOVA, but this tutorial will introduce you to One-Way Repeated-Measures ANOVA.

KINETIC MODELING ON DRUG RELEASE FROM CONTROLLED …
www.ptfarm.pldifferent repeated measures are homogeneous. This is a sufficient condition for the univariate ìFî test for repeated measures to be valid. The spherocity assumption is a necessary and sufficient condition for the F test to be valid. When the compound sym-metry or spherocity assumptions have been violated, the univariate ANOVA table will give ...
Title stata.com mixed — Multilevel mixed-effects linear ...
www.stata.comfreedom. repeated is supported only with two-level models. For more complex mixed-effects models or with unbalanced data, this method typically leads to poor approximations of the actual sampling distributions of the test statistics. anova uses the traditional ANOVA method for computing the DF. According to this method, the DF

Mixed Models for Repeated - University of Vermont
www.uvm.eduthe newly complete data back into a repeated measures ANOVA to see how those results compare. The Data I have created data to have a number of characteristics. There are two groups – a Control group and a Treatment group, measured at 4 times. These times are labeled as 0 …