
Syntax - Stata
addplot(plot) allows adding more graph twoway plots to the graph; see[G-3] addplot option. Y axis, X axis, Titles, Legend, Overall, By twoway options are any of the options documented in[G-3] twoway options. This includes, most importantly, options for titling the graph (see[G-3] title options), options for saving the graph to
Download Syntax - Stata

Information
Domain:
Source:
Link to this page:
Documents from same domain

Syntax - Stata
www.stata.com2cluster kmeans and kmedians— Kmeans and kmedians cluster analysis Options Main k(#) is required and indicates that # groups are to be formed by the cluster analysis.

Syntax Description - Stata
www.stata.com2substr()— Extract substring Diagnostics In substr(s, b, l) and substr(s, b), if b describes a position before the beginning of the string or after the end, "" is returned.

Title stata.com generate — Create or change …
www.stata.comTitle stata.com generate — Create or change contents of variable SyntaxMenuDescriptionOptions Remarks and examplesMethods and formulasReferencesAlso see Syntax Create new variable generate type newvar

SyntaxDescriptionRemarks and examplesAlso see
www.stata.commacro— Macro definition and manipulation 3 Macro extended functions related to matrices rownamesjcolnamesjrowfullnamesjcolfullnames matname roweqjcoleq

Title stata.com graph box — Box plots
www.stata.comgraph box— Box plots 3 Menu Graphics > Box plot Syntax graph box yvars if in weight, options graph hbox yvars if in weight, options where yvars is a varlist options Description

Title stata
www.stata.comarea options — Options for specifying the look of special areas 3 Also see [G-2] graph dot — Dot charts (summary statistics)

www.stata.com
www.stata.com2cluster dendrogram— Dendrograms for hierarchical cluster analysis The height of the vertical lines and the range of the (dis)similarity axis give visual clues about the

Title stata.com putexcel — Export results to an Excel …
www.stata.computexcel— Export results to an Excel file 3 export options Description Main overwritefmt overwrite existing cell formatting when exporting new content

destring — Convert string variables to numeric ... - …
www.stata.comTitle stata.com destring — Convert string variables to numeric variables and vice versa SyntaxMenuDescription Options for destringOptions for tostringRemarks and …

Title stata.com gettoken — Low-level parsing
www.stata.comTitle stata.com gettoken — Low-level parsing SyntaxDescriptionOptionsRemarks and examplesAlso see Syntax gettoken emname1 emname2: emname3, parse("pchars") quotes qed(lmacname) match(lmacname) bind
Related documents

Mega-Fun Fractions - The Mathematics Shed
www.mathematicshed.comcomparing, ordering, and rounding fractions fractions and measurement adding, subtracting, and multiplying fractions culminating activities Feel free to work through the book in any order that suits you. Revisit activities at ... students color each strip a different color for visual ease.

CUDA C++ Best Practices Guide - NVIDIA Developer
docs.nvidia.comtopics are revisited in different contexts as various programming and configuration topics are explored. As a result, it is recommended that first-time readers proceed through the guide sequentially. This approach will greatly improve your understanding of effective programming practices and enable you to better use the guide for reference later.

Module 4 Reactor Theory (Reactor Operations) - Energy
sites.ntc.doe.govConsider a reactor at two different times when k eff is two different values, k 1 and k 2. The neutron level at each time can be determined based on the neutron source strength and the subcritical multiplication factor using Equation (4-3). The equation for N 1 can be divided by the equation for N 2.
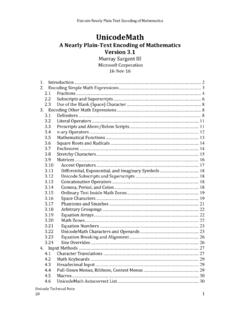
Unicode Plain Text Encoding of Mathematics
www.unicode.org2.1 Fractions One way to specify a fraction linearly is LaTeX’s \frac{numerator}{denominator}. The { } are not printed when the fraction is built up. These simple rules immediately give a “plain text” that is unambiguous, but looks quite different from the correspond-ing mathematical notation, thereby making it harder to read.
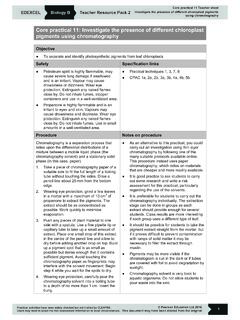
Core practical 11: Investigate the presence of different ...
qualifications.pearson.comdry before adding another drop on top. Build up a pigment spot that is as small as possible but dense enough that it contains sufficient pigment. Avoid touching the chromatography paper as fingerprints may interfere with the solvent movement. Begin step 4 while you wait for the spots to dry. 4. Wearing eye protection, carefully pour the

MARS Tasks | Grade 4 - SCOE
www.scoe.orgMARS MARS Tasks | Grade 4 Page Name of MARS Task Year Math Strand Notes * Shapes with Straws 2003 NO, GM Prob. @ divisors, multiples in geo. figures * Number Trains 2003 PFA, NO Prob. @ factors, multiples in toy trains * Hexagon Desks 2003 PFA Find, analyze # of chairs needed, graph * Flower Arranging 2003 NP Divide number into parts, conditions

Grade 7 Mathematics Instructional Focus Documents
www.tn.govJul 31, 2019 · Compute unit rates associated with ratios of fractions, including ratios of lengths, areas, and other quantities measured in like or different units. For example, if a person walks 1/2 mile in each 1/4 hour, compute the unit rate as the complex fraction 1/2/1/4 miles per hour, equivalently 2 miles per hour. Evidence of Learning Statements

Fractions as Numbers - Intensive Intervention
intensiveintervention.orgActivity Two: Comparing Fractions With Different Denominators40\渀 ... adding and subtracting fractions. 1 8 + 2 8 . Equivalent Fractions: Fractions with equal value. = 4 6 . 2 3 = 2 8 1 4 . Unit Fraction: A fraction with 1 in the numerator. 1 12 . 1 8 1 5 1 3 1 2 , , , ,

Fraction Unit Notes - Ms. Ledoux's Class: 2020-2021
msledoux2012.weebly.comFor adding and subtracting fractions, you need to find a common denominator for the fractions before you can add or subtract. This means that you need to rename the fractions as equivalent fractions with the same denominator. (See Page 4: Equivalent fractions) Adding Fractions Example 1: Adding Proper Fractions = 2 4 + 3 8 = 4 8 + 3 8 = 7 8