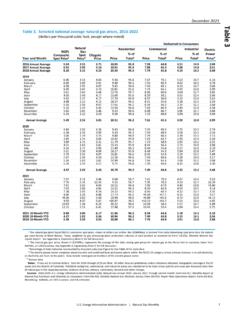
Table - Energy Information Administration
a The naturalgas plant liquid (NGPL) composite spotprice, shown in dollars per million Btu ($/MMBtu), is derived from daily Bloomberg price data for gas plant liquids at Mont Belvieu, Texas, weighted by gas processing plant production volumes of each product as reported on Form EIA‐816, Monthly Natural Gas
Download Table - Energy Information Administration
Information
Domain:
Source:
Link to this page:
Documents from same domain

Weekly Petroleum Status Report
www.eia.govv Weekly Petroleum Status Report/Energy Information Administration U.S. crude oil refinery inputs averaged 17.2 million barrels per day during the week ending July 13, 2018, which was 413,000 barrels per

Cost and Performance Characteristics of New …
www.eia.govU.S. Energy Information Administration | Cost and Performance Characteristics of New Generating Technologies, Annual Energy Outlook 2018 1

2016 Average Monthly Bill- Residential
www.eia.gov2016 Average Monthly Bill- Residential (Data from forms EIA-861- schedules 4A-D, EIA-861S and EIA-861U) State Number of Customers Average Monthly

Oil market outlook and drivers - U.S. Energy …
www.eia.govWorld supply and demand million barrels per day implied stock change million barrels per day NAS | Oil market outlook and drivers, May 4, 2016 Global supply has consistently exceeded demand since the start of 2014;

Natural Gas Monthly - Energy Information …
www.eia.govJune 2018 ii U.S. Energy Information Administration | Natural Gas Monthly This report was prepared by the U.S. Energy Information Administration (EIA), the …

Year-over-year summary July 2018
www.eia.govU. S. Energy Information Administration | Drilling Productivity Report 0 1,000 2,000 3,000 4,000 5,000 Anadarko Appalachia Bakken Eagle Ford Haynesville Niobrara Permian

U.S. Energy Information Administration
www.eia.govIndependent Statistics & Analysis Drilling Productivity Report July 2018 For key tight oil and shale gas regions U.S. Energy Information Administration

Monthly Energy Review - Energy Information …
www.eia.govMonthly Energy Review The Monthly Energy Review (MER) is the U.S. Energy Information Administration’s (EIA) primary report of recent and historical energy statistics. Included are statistics on total energy production, consump

STEO Current/Previous Forecast Comparisons: U.S. …
www.eia.govCurrent Forecast: July 10, 2018; Previous Forecast: June 12, 2018 Q1 Q2 Q3 Q4 Q1 Q2 Q3 Q4 Q1 Q2 Q3 Q4 2016 2017 2018 2019 2016-2017 2017-2018 2018-2019

PADD 5 Transportation Fuels Markets - U.S. Energy ...
www.eia.govU.S. Energy Information Administration | PADD 5 Transportation Fuels Markets i . This report was prepared by the U.S. Energy Information Administration (EIA), the …
Related documents

Chlorides in Fresh Water - University of Rhode Island
cels.uri.eduChlorides in Fresh Water URI WATERSHED WATCH, Cooperative Extension College of the Environment and Life Sciences (CELS) Department of Natural Resources Science (NRS)
Proved Reserves of Crude Oil and Natural Gas in the United ...
www.eia.govProved Reserves of Crude Oil and . Natural Gas in the United States, Year-End 2020. January 2022 Independent Statistics & Analysis www.eia.gov
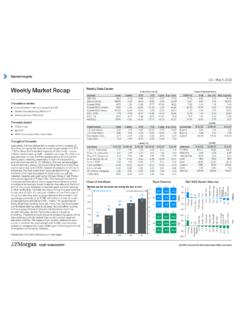
Weekly Market Recap - J.P. Morgan
am.jpmorgan.comNaturalGas 4.73 3.82 2.70 Gasoline 4.10 3.28 2.77 Oil(WTI) 109.33 75.33 66.02 Commod. 3/11/22 12/31/21 3/11/21 ChartoftheWeek StyleReturns S -0.4 -1.0 -1.8 M -2.0 -2.7 -4.3 L -2.2 -2.8 -3.6 V B G 1Week S -5.3 -11.7 -18.0 M -7.1 -12.0 -20.7 L -5.6 -11.5 -17.9 V B G YTD S&P500SectorReturns-8-4 0 4 8 Utilities Materials Real Estate Financials ...

Chapter 5 Thermochemistry - University of North Georgia
web.ung.eduChapter 5 Thermochemistry Figure 5.1 Sliding a match head along a rough surface initiates a combustion reaction that produces energy in the form of heat and light. (credit: modification of work by Laszlo Ilyes) Chapter Outline 5.1Energy Basics 5.2Calorimetry

Morning News Call Canada
share.thomsonreuters.comhitting exports ofcrude oil, liquefied naturalgas (LNG) and coal from April, but there are alreadysigns that flows are weakening. 1. MORNING NEWS CALL -CANADIAN EDITION March 15, 2022 REFI N ITIV'" DATA IS JUST THE BEGINNING ~ ANALYSTS' RECOMMENDATION

Operation and Maintenance
downloads.hearthnhome.comHeatilator • NDV30-IFT, NDV33-IFT, NDV36-IFT, NDV36-IFT-NVR, NDV42-IFT Owner’s Manual • 2620-981 Rev. F • 2/22 1 Models: NOTICE: DO NOT discard this manual! This appliance may be installed as an OEM

Discharge coefficients of square-edged orifices for ...
nvlpubs.nist.gov562 BureauofStandardsJournalofResearch [vol.s Page XVII.Commentsontheresultsforflangetaps 598 XVIII.Resultsforpipetaps 599 XIX.Commentsontheresultsforpipetaps 601 XX ...

NYS Clean Heat Program Residential Incentive Changes ...
saveenergy.ny.govMar 01, 2022 · Effective March 1, 2022, NYS Clean Heat program incentives for residential projects in Central Hudson, Con Edison, and Orange & Rockland service territories will change to the amounts indicated in the table below, as shown in red font.These changes apply only to Categories 1, 2, 2a, and 2b.