
Tables of Constants for Control charts
Tables of Formulas for Control charts Control Limits Samples not necessarily of constant size u chart for number of incidences per unit in one or more categories If the Sample size is constant (n) p chart for proportions of units in a category CL p = p CL np = pn CL c = c CL u = u i p n p p UCL p i 1( ) 3 − = + i p n p p LCL p i 1( ) 3 − ...
Download Tables of Constants for Control charts
Information
Domain:
Source:
Link to this page:
Documents from same domain

Wireless Communications and Networks
web.mit.edu4 MIT Physical layer •The physical layer plays a very important role in wireless network because it has severe limitation on transmissions Uplink with respect to downlink
The Aleph - MIT
web.mit.eduThe Aleph by Jorge Luis Borges O God! ... He read me many other stanzas, each of which also won his own approval and elicited his lengthy explications.
Finite Element Method
web.mit.eduRobert Cook, Finite Element Modeling For Stress Analysis, John Wiley & Sons, 1995 Introduction to Finite Element Method, http://210.17.155.47 (in Korean)
Finite Element Analysis
web.mit.eduFinite Element Analysis David Roylance Department of Materials Science and Engineering Massachusetts Institute of Technology Cambridge, MA 02139 February 28, …
TECHNICAL & SERVICE MANUAL - MIT
web.mit.eduwhen wiring electrical shock can cause severe personal injury or death. only a qualified, experienced electrician should attempt to wire this system.
Chapter 21 Rigid Body Dynamics: Rotation and …
web.mit.eduChapter 21 Rigid Body Dynamics: Rotation and ... patience to the establishment of the laws of rotation of the solid ... general treatment of mechanics, ...
5.33 Lecture Notes: Introduction To Polymer …
web.mit.edu5.33 Lecture Notes: Introduction To Polymer Chemistry Polymer: A large molecule (macromolecule) built up by repetitive bonding (covalent) of smaller molecules (monomers) • Generally not a well defined structure, or molecular weight.
UNDERSTANDING, FINDING, & ELIMINATING …
web.mit.edua Senior Member of the Institute of Electrical and Electronic Engineers. CEDIA EST016 UNDERSTANDING, ... GROUNDING, AC POWER, AND SAFETY ...
PRESENTED AT THE 2004 AMERICAN CONTROL …
web.mit.eduPRESENTED AT THE 2004 AMERICAN CONTROL CONFERENCE 1 Internal and External Op-Amp Compensation: A Control-Centric Tutorial ... circuit operational …

Frank and Lillian Gilbreth and the Manufacture and ...
web.mit.eduFrank and Lillian Gilbreth and the Manufacture ... time study, despite its ... publicizing micro-motion study as an advance over time study and as an
Related documents

X-bar and R Control Charts - MoreSteam
www.moresteam.comX-bar and R Control Charts An X-Bar and R-Chart is a type of statistical process control chart for use with continuous data collected in subgroups at set time intervals - usually between 3 to 5 pieces per subgroup. The Mean (X-Bar) of each subgroup is charted on the top graph and the Range (R) of the ...

WebPlotDigitizer User Manual Version 4 - Automeris
automeris.io1 Introduction A large quantity of technical data is available only in the form of plots and images. In these images, it is easy to visualize the relationship …

Using Graphs and Charts to Illustrate No. 12 | updated …
www.cdc.govBar graphs, line graphs, and histograms have an x- and y-axis. The x-axis is the horizontal part of the graph and . the y-axis is the vertical part. Types of Graphs and Charts • A . bar graph. is composed of discrete bars . that represent different categories of data. The length or height of the bar is equal to the quantity within that ...
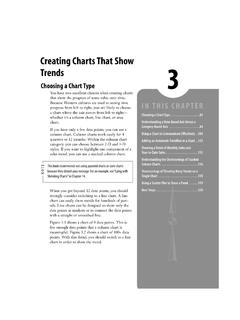
Creating Charts That Show Trends - pearsoncmg.com
ptgmedia.pearsoncmg.comIn Figure 3.5, the same data is plotted as a 100% stacked bar chart. Series lines guide the reader’s eye from the market share from each year to the next year. The stacked bar chart is a much easier chart to read than the series of pie charts. Figure 3.5 In a 100% stacked bar chart,the same data from Figure 3.4 is easier to read.

TRADECIETY
www.tradeciety.comengulfing bar. The first bar is larger than the second one and the smaller candle completely falls into the range of the larger one. The image below shows a scenario with two inside bar patterns during a downtrend. In this example, the inside bar is a trend continuation pattern where the market briefly pauses.
Title stata.com graph bar — Bar charts
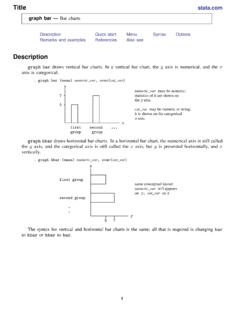
www.stata.comgraph bar — Bar charts DescriptionQuick startMenuSyntaxOptions Remarks and examplesReferencesAlso see Description graph bar draws vertical bar charts. In a vertical bar chart, the y axis is numerical, and the x axis is categorical.. graph bar (mean) numeric_var, over(cat_var) y numeric_var must be numeric; 7 statistics of it are shown on the ...
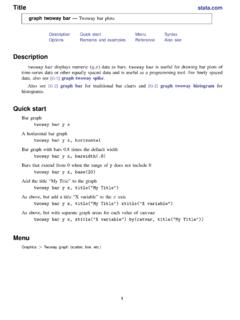
graph twoway bar — Twoway bar plots - Stata
www.stata.comAlso see[G-2] graph bar for traditional bar charts and[G-2] graph twoway histogram for histograms. Quick start Bar graph twoway bar y x A horizontal bar graph twoway bar y x, horizontal Bar graph with bars 0.8 times the default width twoway bar y x, barwidth(.8) Bars that extend from 0 when the range of y does not include 0 twoway bar y x, base(20)

Counting Insects Bar Chart Worksheet - K5 Learning
www.k5learning.comCounting Insects Bar Chart Worksheet Author: K5 Learning Subject: Data and Graphing Worksheet - Reading Bar Charts Keywords: worksheet, data, graphing, bar chart, grade 1 Created Date: 5/17/2021 11:08:14 AM