The Average and Standard Deviation
The Standard Deviation (SD) The SD is a measure of how spread out numbers are around their average. Here is the recipe for calculating it: •Subtract mean from each number •Square the results •Add them up •Divide by the length of the list •Take square root of result SD is the square root of the average squared deviation from the mean 21
Download The Average and Standard Deviation

Information
Domain:
Source:
Link to this page:
Documents from same domain
One Hundred Solved Exercises for the subject: …
www.stat.berkeley.eduOne Hundred1 Solved2 Exercises3 for the subject: Stochastic Processes I4 ... If the probability of rain is p, what is the probability that I get wet? 2.
International Relations Theory and the End of the …
www.stat.berkeley.eduInternational Relations Theory and the End of the Cold War Author(s): John Lewis Gaddis ... out of efforts to construct theories of international relations. There is a very simple reason for this: visions of any future have to proceed from the awareness of some kind of past; otherwise there can be no ...
Sampling - Department of Statistics
www.stat.berkeley.edusample” consists of the people willing to be interviewed on certain days at certain shopping centers. This too is a convenience sample. The reason This too is a convenience sample. The reason
Computing in the Statistics Curricula
www.stat.berkeley.educomputational problems and vocabulary into traditional statistics courses. 1.2 Our Backgrounds We have been thinking about and working on making changes in these directions for several years.
Brownian Motion and An Introduction to Stochastic Integration
www.stat.berkeley.eduBrownian Motion and An Introduction to Stochastic Integration Arturo Fernandez University of California, Berkeley Statistics 157: Topics In Stochastic Processes Seminar
Introduction to Time Series Analysis. Lecture 1.
www.stat.berkeley.eduIntroduction to Time Series Analysis. Lecture 1. Peter Bartlett 1. Organizational issues. 2. Objectives of time series analysis. ... Time Series Analysis and its Applications. With R Examples, Shumway and Stoffer. 2nd Edition. 2006. 2. ... Forecasting. Example: Predict unemployment. 4. Control. Example: Impact of …
Lecture Notes for Introductory Probability
www.stat.berkeley.eduLecture Notes for Introductory Probability Janko Gravner Mathematics Department University of California Davis, CA 95616 ... The theory of probability has always been associated with gambling and many most accessible ... The probability of this is 4 times the probability …

Conservative statistical post-election audits - Berkeley
www.stat.berkeley.eduthat requires post-election audits of randomly selected precincts, “to ensure with at least 99% statistical power that for each federal, gubernatorial or other Statewide election held in the State, a 100% manual recount of the voter-verifiable paper
Introduction to SQL - Department of Statistics
www.stat.berkeley.eduIntroduction to SQL What is SQL? I Structured Query Language I Usually “talk” to a database server I Used as front end to many databases (mysql, postgresql, oracle, sybase) I Three Subsystems: data description, data access and privileges I Optimized for certain data arrangements I The language is case-sensitive, but I use upper case for keywords.
Reversible Markov Chains and Random Walks on Graphs
www.stat.berkeley.eduReversible Markov Chains and Random Walks on Graphs David Aldous and James Allen Fill Un nished monograph, 2002 (this is recompiled version, 2014)
Related documents
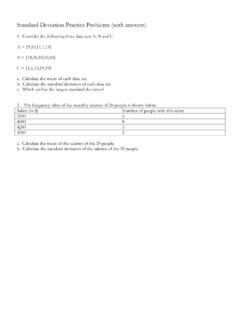
Standard Deviation Practice Problems (with answers)
mrcasalinuovo.weebly.comThe sample mean and sample standard deviation are (approximately): (a) 20 and 79.2 respectively (b) 20 and 8.9 respectively. (c) 120 and 79.2 respectively. (d) 20 and 8.2 respectively. (e) 120 and 8.9 respectively. 5. A sample of underweight babies was fed a special diet and the following weight gains (lbs) were observed at the end of three month.

Calculating the mean and standard deviation on a calculator
www.mas.ncl.ac.uksample standard deviation s; for example, press 4 (corresponding to sx for the sample standard deviation), then press = to get the answer. Note that you need to repeat the process under `for each numerical summary. You should get 15 for the mean, and 18.083 (to three decimal places) for the standard deviation; these

How$to$Calculate$Mean,$Standard$Deviation$ …
media.hhmi.orgstandard#deviationtoappear. 6.Select#the#values#that#youwant#touse#tocalculate#the#standar d deviation—the#same#ones#you#used#for#the#mean. As!you!type,!Excel!will!display! matching!functions!in!a!dropFdown! menu.!Click!“STDEV.S”!when!it! appears.!(Notethat!“STDEV.S”!is!the function!for!sample!standard! deviation.!Excel!has!another!
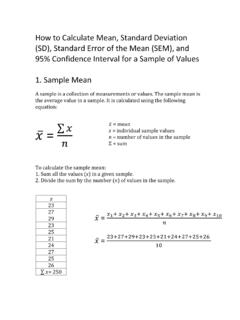
How$to$Calculate$Mean,$Standard$Deviation$ …
media.hhmi.org2. Sample$Standard$Deviation$(SD) TheSD!is!a!measure!of!thevariability!of !individualvalues!inthatsample! fromthesamplemean .!Itiscalculatedusing!thefollowing!equation :
Confidence Intervals for One Standard Deviation Using ...
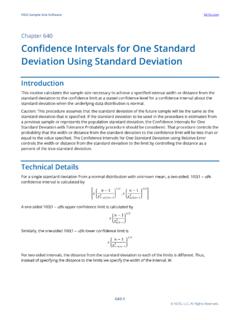
ncss-wpengine.netdna-ssl.comstandard deviation to the confidence limit at a stated confidence level for a confidence interval about the standard deviation when the underlying data distribution is normal. Caution: This procedure assumes that the standard deviation of the future sample will be the same as the standard deviation that is specified.

Tests for Standard Deviations (Two or More Samples)
support.minitab.comSample Standard Deviation test in the Assistant. To do this, we needed to evaluate whether the approximated theoretical power function accurately reflects the actual power achieved by the Bonett test when it is performed on data from several types of distributions, including normal
Mean and Standard Deviation - University of York
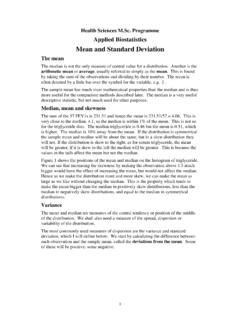
www-users.york.ac.ukstandard deviation, usually denoted by s. It is often abbreviated to SD. For the FEV data, the standard deviation = 0.449 = 0.67 litres. Figure 2 shows the relationship between mean, standard deviation and frequency distribution for FEV1. Because standard deviation is a measure of variability about the mean, this is shown

Deviation Report System Sample - GMPSOP
www.gmpsop.com2.2.2. QA has to evaluate the deviation and assess the potential impact to the product quality, validation and regulatory requirement. All DRs to be approved by QA Manager or delegate. QA manger to justify wither the deviation is a Critical, Serious or Standard. For a deviation of either critical or serious nature QA delegate has to