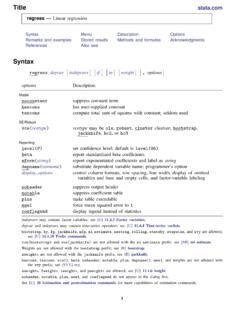
Title stata.com regress — Linear regression
calculations made by predict, where the residual would be calculated as deviations from varname rather than depvar. depname() is most typically used when depvar is a temporary variable (see ... At the upper left, regress reports an analysis-of-variance (ANOVA) table. The column headings SS,
Download Title stata.com regress — Linear regression

Information
Domain:
Source:
Link to this page:
Documents from same domain

Syntax - Stata
www.stata.com2cluster kmeans and kmedians— Kmeans and kmedians cluster analysis Options Main k(#) is required and indicates that # groups are to be formed by the cluster analysis.

Syntax Description - Stata
www.stata.com2substr()— Extract substring Diagnostics In substr(s, b, l) and substr(s, b), if b describes a position before the beginning of the string or after the end, "" is returned.

Title stata.com generate — Create or change …
www.stata.comTitle stata.com generate — Create or change contents of variable SyntaxMenuDescriptionOptions Remarks and examplesMethods and formulasReferencesAlso see Syntax Create new variable generate type newvar

SyntaxDescriptionRemarks and examplesAlso see
www.stata.commacro— Macro definition and manipulation 3 Macro extended functions related to matrices rownamesjcolnamesjrowfullnamesjcolfullnames matname roweqjcoleq

Title stata.com graph box — Box plots
www.stata.comgraph box— Box plots 3 Menu Graphics > Box plot Syntax graph box yvars if in weight, options graph hbox yvars if in weight, options where yvars is a varlist options Description

Title stata
www.stata.comarea options — Options for specifying the look of special areas 3 Also see [G-2] graph dot — Dot charts (summary statistics)

www.stata.com
www.stata.com2cluster dendrogram— Dendrograms for hierarchical cluster analysis The height of the vertical lines and the range of the (dis)similarity axis give visual clues about the

Title stata.com putexcel — Export results to an Excel …
www.stata.computexcel— Export results to an Excel file 3 export options Description Main overwritefmt overwrite existing cell formatting when exporting new content

destring — Convert string variables to numeric ... - …
www.stata.comTitle stata.com destring — Convert string variables to numeric variables and vice versa SyntaxMenuDescription Options for destringOptions for tostringRemarks and …

Title stata.com gettoken — Low-level parsing
www.stata.comTitle stata.com gettoken — Low-level parsing SyntaxDescriptionOptionsRemarks and examplesAlso see Syntax gettoken emname1 emname2: emname3, parse("pchars") quotes qed(lmacname) match(lmacname) bind
Related documents
ANALYSIS OF CONTINUOUS VARIABLES COMPARING MEANS
surgicalcriticalcare.netANOVA ANOVA Figure 6-1: Analysis of Continuous Variables COMPARING MEANS There are three factors which determine whether an observed sample mean is different from another mean or normal value. First, the larger the difference between the means, the …

Quantitative Research Designs: Experimental, Quasi ...
samples.jbpub.comOne-way analysis of variance (ANOVA) F To test the difference among means of more than two independent groups for one independent variable (with more than one level). More than two groups Interval/ratio Two-way analysis of variance (ANOVA) F To test the difference among

Profile Analysis - San Francisco State University
userwww.sfsu.eduProfile Analysis . Introduction . Profile analysis is the multivariate equivalent of repeated measures or mixed ANOVA. Profile analysis is most commonly used in two cases: 1) Comparing the same dependent variables between groups over several time-points. 2) When there are several measures of the same dependent variable (Ex.
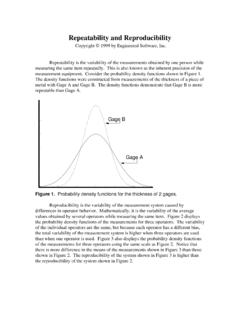
Repeatability and Reproducibility - Engineered Software
www.engineeredsoftware.comAnalysis of Variance Method The analysis of variance method (ANOVA) is the most accurate method for quantifying repeatability and reproducibility. In addition, the ANOVA method allows the variability of the interaction between the appraisers and the parts to be determined.

CALCULATIONS IN THE ANALYSIS OF VARIANCE (ANOVA)
oak.ucc.nau.eduCALCULATIONS IN THE ANALYSIS OF VARIANCE (ANOVA) Howell, D. C. (2007). Statistical Methods for Psychology (6th ed.). Pacific Grove, CA: Duxbury. Summary Table for the One-way ANOVA Summary ANOVA Source Sum of Squares Degrees of Freedom Variance Estimate (Mean Square) F Ratio Between SS B K – 1 MS B = K-1 SS B W B MS MS Within SS W N – K MS ...

ANOVA MC QUESTIONS FINAL 4PDF - Dalhousie University
awarnach.mathstat.dal.cab. represent evidence for the null hypothesis of ANOVA c. represent evidence against the null hypothesis of ANOVA d. can be very misleading, you should not be looking at box plots in this setting 29. ANOVA was used to test the outcomes of three drug treatments. Each drug was given to 20 individuals. The MSE for this analysis was 16.
An Introduction to R
cran.r-project.orga suite of operators for calculations on arrays, in particular matrices, a large, coherent, integrated collection of intermediate tools for data analysis, graphical facilities for data analysis and display either directly at the computer or on hard-copy, and a well developed, simple and effective programming language (called ‘S’) which includes

Multivariate Analysis of Variance (MANOVA)
ncss-wpengine.netdna-ssl.comMultivariate Analysis of Variance (MANOVA) Introduction Multivariate analysis of variance (MANOVA) is an extension of common analysis of variance (ANOVA). In ANOVA, differences among various group means on a single-response variable are studied. In MANOVA, the number of response variables is increased to two or more.