
Two-Sample T-Tests Assuming Equal Variance
Alpha is the probability of obtaining a false positive with the statistical test. That is, it is the probability of rejecting a true null hypothesis. The null hypothesis is usually that the parameters of interest (means, proportions, etc.) are equal. Since Alpha is a probability, it is bounded by 0 and 1. Commonly, it is between 0.001 and 0.10
Download Two-Sample T-Tests Assuming Equal Variance

Information
Domain:
Source:
Link to this page:
Documents from same domain

Mixed Models - Repeated Measures - Statistical …
ncss-wpengine.netdna-ssl.comMixed Models – Repeated Measures Introduction ... analysis, and the amount of data available for the analysis. When more than one fixed factor may influence the

Repeated Measures Analysis - NCSS
ncss-wpengine.netdna-ssl.comThis section provides the technical details of the repeated measures designs that can be analyzed by PASS. Earlier ... Repeated Measures Analysis ...

Chapter 469 Decomposition Forecasting - NCSS
ncss-wpengine.netdna-ssl.comChapter 469 Decomposition Forecasting Introduction Classical time series decomposition separates a time series into five components: mean, long-range trend, seasonality, cycle, and randomness. The decomposition model is Value = (Mean) x (Trend) x (Seasonality) x (Cycle) x (Random).

Chapter 575 Probit Analysis - Statistical Software
ncss-wpengine.netdna-ssl.comChapter 575 Probit Analysis Introduction Probit Analysis is a method of analyzing the relationship between a stimulus (dose) and the quantal (all or nothing) response. Quantitative responses are almost always preferred, but in many situations they are not practical. In these cases, it is only possible to determine if a certain response (such as ...

Chapter 720 Probit Analysis - Statistical Software
ncss-wpengine.netdna-ssl.comChapter 720 Probit Analysis. Introduction . Probit and logit analysis may be used for comparative LD. 50. studies for testing the efficacy of drugs designed to prevent lethality. This program module presents calculates power and sample size using the methodology outlined

Chapter 311 Stepwise Regression - Statistical Software
ncss-wpengine.netdna-ssl.comNCSS Statistical Software NCSS.com © NCSS, LLC. All Rights Reserved.

Chapter 208 Paired T-Test - NCSS
ncss-wpengine.netdna-ssl.comNCSS Statistical Software NCSS.com Paired T-Test 208-6 © NCSS, LLC. All Rights Reserved. Tests Alpha Alpha is the significance leve l used in the hypothesis tests.

Multivariate Analysis of Variance (MANOVA)
ncss-wpengine.netdna-ssl.comNCSS Statistical Software NCSS.com Multivariate Analysis of Variance (MANOVA) 415-4 © NCSS, LLC. All Rights Reserved. Assumptions and Limitations

Chapter 194 Normality Tests - NCSS
ncss-wpengine.netdna-ssl.comNCSS Statistical Software NCSS.com © NCSS, LLC. All Rights Reserved.

Distribution Weibull Fitting - NCSS
ncss-wpengine.netdna-ssl.comDistribution (Weibull) Fitting Introduction This procedure estimates the parameters of the exponential, extreme value, logistic, log-logistic, lognormal, normal, and Weibull probability distributions by maximum likelihood. It can fit complete, right censored, left censored, interval censored (readou t), and grouped data values.
Related documents

ANOVA MC QUESTIONS FINAL 4PDF - Dalhousie University
awarnach.mathstat.dal.ca28. Assume that there is no overlap between the box and whisker plots for three drug treatments where each drug was administered to 35 individuals. The box plots for these data: a. provide no evidence for, or against, the null hypothesis of ANOVA b. represent evidence for the null hypothesis of ANOVA
Lecture 2 Linear Regression: A Model for the Mean
www.columbia.eduTests and Confidence Intervals for β 0, β 1 Degrees of freedom: (n-2) = sample size - number of coefficients Variance {Y|X} σ22= (sum of squared residuals)/(n-2) Standard errors (p. 184) Ideal normal model: the sampling distributions of β 0 and β 1 have the shape of a t-distribution on (n-2) d.f. Do t-tests and CIs as usual (df=n-2)
Lesson 8: Bell Curves and Standard Deviation
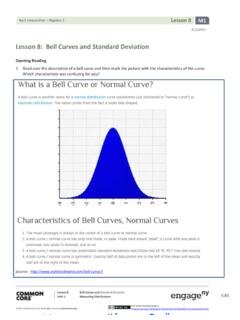
mrpunpanichgulmath.weebly.comTo understand the probability factors of a normal distribution you need to understand the following “rules”: 1. The total area under the curve is equal to 1 (100%). 2. About 68% of the area under the curves falls within 1 standard deviation. 3. About 95% of the area under the curve falls within 2 standard deviations. 4.

Breaking Down Barriers: Academic Obstacles of First ...
files.eric.ed.govof the study showed that the Kolmogorov-Smirnov tests were significant (p < .05), suggesting non-normal distributions; however, in large samples, this test can be significant even if the data are only slightly non-normal (Field, 2009). In examining the histograms and Q-Q plots, evidence was found for slight skewness in several of the factors.

Assumptions of Multiple Regression - Open University
www.open.ac.uk#1. This tutorial will now take you through the SPSS output that tests the last 5 assumptions. Assumption #2: There is no multicollinearity in your data. The first assumption we can test is that the predictors (or IVs) are not too highly correlated. We can do this in two ways. First, we need to look at the Correlations table. Correlations of ...