Two-way ANOVA and ANCOVA
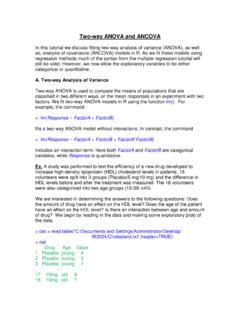
Two-way ANOVA and ANCOVA In this tutorial we discuss fitting two-way analysis of variance (ANOVA), as well as, analysis of covariance (ANCOVA) models in R.
Download Two-way ANOVA and ANCOVA
Information
Domain:
Source:
Link to this page:
Documents from same domain
Lecture 15 Introduction to Survival Analysis
www.stat.columbia.eduLecture 15 Introduction to Survival Analysis BIOST 515 February 26, 2004 BIOST 515, Lecture 15

Multiple Linear Regression - Columbia University
www.stat.columbia.eduMultiple Linear Regression A regression with two or more explanatory variables is called a multiple regression. Rather than modeling the …

Sample size and power calculations - Columbia …
www.stat.columbia.eduCHAPTER 20 Sample size and power calculations 20.1 Choices in the design of data collection Multilevel modeling is typically motivated by features in …

One and Two-sample t-tests - Columbia University
www.stat.columbia.eduOne and Two-sample t-tests The R function t.test() can be used to perform both one and two sample t-tests on vectors of data. The function contains a variety of options and can be called as follows:

Statistics and Research Integrity - Columbia University
www.stat.columbia.eduEuropean Science Editing 13 February 2015; 41(1) Another important challenge was receiving fewer essays from Balkan authors than expected and convincing the referees

Linear Regression - Columbia University
www.stat.columbia.eduLinear Regression In this tutorial we will explore fitting linear regression models using STATA. We will also cover ways of re-expressing variables in a …
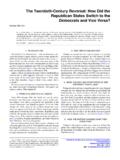
The Twentieth-Century Reversal: How Did the …
www.stat.columbia.eduGelman: The Twentieth-Century Reversal: How Did the Republican States Switch to the Democrats and Vice Versa? 3 of, and more …

Abandon Statistical Signi cance - Department of …
www.stat.columbia.eduAbandon Statistical Signi cance Blakeley B. McShane1, David Gal2, Andrew Gelman3, Christian Robert4, and Jennifer L. Tackett1 1Northwestern University, 2University of …

Colors in R - Columbia University
www.stat.columbia.educolor name color name gray8 gray9 gray10 gray11 gray12 gray13 gray14 gray15 gray16 gray17 gray18 gray19 gray20 gray21 gray22 gray23 gray24 gray25 gray26 gray27 gray28
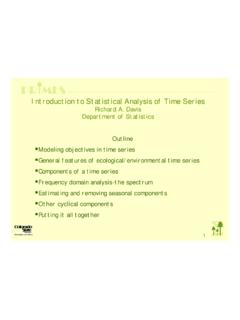
Putting it all together Richard A. Davis - Columbia …
www.stat.columbia.edu2 Time Series: A collection of observations x t, each one being recorded at time t. (Time could be discrete, t = 1,2,3,…, or continuous t > 0.) Objective of Time Series Analaysis
Related documents

SPSS Custom Tables Create Custom Tables in No …
spss.chCreate Custom Tables in No Time SPSS Custom Tables™ 17.0 Easily analyze and communicate your results with SPSS Custom Tables, an add-on module for the
Making Tables and Figures - SUNY Cortland
web.cortland.edu199 Making Tables and Figures Don Quick Colorado State University Tables and figures are used in most fields of study to provide a visual presentation of important

CREATE PATHWAYS TO ACCESS Research …
www.create-rpc.orgDropping Out from School: A Cross-Country Review of Literature Frances Hunt CREATE PATHWAYS TO ACCESS Research Monograph No 16 May 2008
Annex D: Carr-Hill resource allocation formula - …
www.nhsemployers.orgAnnex D: Carr-Hill resource allocation formula Introduction 1. This annex presents the core findings from the analysis used to derive the Carr-Hill
Cluster Analysis - IBM SPSS Statistics Guides: …
www.norusis.com365 Cluster Analysis Warning: The computation for the selected distance measure is based on all of the variables you select. If you have a mixture of nominal and continuous variables, you must use the two-step cluster procedure …

Part 4: Data Management and Analysis, Reporting …
www.who.intPart 4: Data Management and Analysis, Reporting and Disseminating Results 4-1-2 Section 1: Creating the Final Dataset WHO STEPS Surveillance

242-30: Arrays Made Easy: An Introduction to …
www2.sas.com1 Paper 242-30 Arrays Made Easy: An Introduction to Arrays and Array Processing Steve First and Teresa Schudrowitz, Systems Seminar Consultants, Inc., Madison, WI

How To Use Propensity Score Analysis - …
www.mc.vanderbilt.eduOutline Background/Motivation Propensity Score Estimation Propensity Score Matching Regression Adjustment/Stratification Example Code/Analysis Conclusions References