
Using SPSS, Chapter 9: Hypothesis Testing - Two Samples
Hypothesis Testing - Two Samples Chapter 9.1 - Hypothesis Tests for Mean Di erences: Paired Data 2 SPSS does this really well but you do need the raw data. Click here for online calculators that work well with summary statistics. Chapter 9.2 - Hypothesis Tests for Two Means: Independent Data 4 SPSS does this really well but you do need the raw ...
Download Using SPSS, Chapter 9: Hypothesis Testing - Two Samples

Information
Domain:
Source:
Link to this page:
Documents from same domain
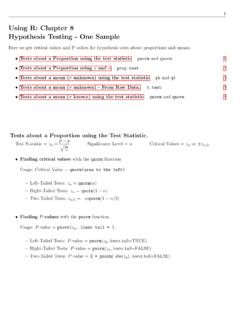
Using R: Chapter 8 Hypothesis Testing - One Sample
cosmosweb.champlain.eduUsing R: Chapter 8 Hypothesis Testing - One Sample Here we get critical values and P-values for hypothesis tests about proportions and means. Tests about a Proportion using the test statistic pnorm and qnorm. 1 Tests about a Proportion using xand n prop.test 2 Tests about a mean (˙unknown) using the test statistic pt and qt 3

Using SPSS, Chapter 8: Hypothesis Testing - One Sample
cosmosweb.champlain.eduChapter 8.3 - Hypothesis Tests About a Mean: ˙Not Known 1.Open or create your data. It must be in the form of rows=cases and columns=variables. SPSS can not be used with only the summarizing statistics (mean, standard deviation, sample size). Below left is the sample data. The sample mean is 38.6 and the sample standard deviation is 8.5. 2.

Using Excel, Chapter 8: Hypothesis Testing - One Sample
cosmosweb.champlain.eduChapter 8.2 - Hypothesis Testing About a Proportion Notation { Test Statistic = z ^p = p^ p q pq n { Signi cance Level = (in decimal form) { Critical Values = z or z =2 Finding Critical Values Here we use the NORM.S.INV function. NORM.S.INV stands for the inverse of the standard normal distribution (z-distribution).

Using R: Frequency Distributions, Histograms, Scatterplots ...
cosmosweb.champlain.eduThen we created a relative and cumulative frequency table from this. Frequency Distribution: Males Scores Frequency 30 - 39 1 40 - 49 3 50 - 59 5 60 - 69 9 70 - 79 6 80 - 89 10 90 - 99 8 Relative Frequency Distribution: Males Relative Scores 30 - 39 2.4% 40 - 49 7.1% 50 - 59 11.9% 60 - 69 21.4% 70 - 79 14.3% 80 - 89 23.8% 90 - 99 19.0% ...

Using R, Chapter 6: Normal Distributions pnorm and …
cosmosweb.champlain.edu1 Using R, Chapter 6: Normal Distributions The pnorm and qnorm functions. Getting probabilities from a normal distribution with mean and standard deviation ˙

Using the TI-83/84 Plus Chapter 8: Hypothesis Testing ...
cosmosweb.champlain.eduChapter 8: Hypothesis Testing - One Sample Here we see how to use the TI 83/84 to conduct hypothesis tests about proportions and means. The software will calculate the test statistic and the P-value for the test statistic. It does not give you the critical value.
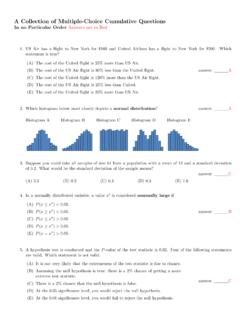
A Collection of Multiple-Choice Cumulative Questions In …
cosmosweb.champlain.eduA Collection of Past Questions Organized by Chapter Chapter 1: Sampling, Levels of Measurement, Percentages 1.A random sample is one with which characteristic? (A)Its members are chosen haphazardly. answer: (B)Every member of the population has an equal chance of being chosen for the sample.
Related documents
DEVELOPING HYPOTHESIS AND RESEARCH QUESTIONS
www.public.asu.edu“A hypothesis is a conjectural statement of the relation between two or more variables”. (Kerlinger, 1956) “Hypothesis is a formal statement that presents the expected relationship between an independent and dependent variable.”(Creswell, 1994) “A research question is essentially a hypothesis …
Hypothesis Testing - University of Utah
www.sci.utah.eduSummary Properties of hypothesis testing 1. and are related; decreasing one generally increases the other. 2. can be set to a desired value by adjusting the critical value. Typically, is set at 0.05 or 0.01. 3.Increasing ndecreases both and . 4. decreases as the distance between the true value and hypothesized value (H 1) increases.
Chapter 3 Total variation distance between measures
www.stat.yale.edu4 Chapter 3: Total variation distance between measures If λ is a dominating (nonnegative measure) for which dµ/dλ = m and dν/dλ = n then d(µ∨ν) dλ = max(m,n) and d(µ∧ν) dλ = min(m,n) a.e. [λ]. In particular, the nonnegative measures defined by dµ +/dλ:= m and dµ−/dλ:= m− are the smallest measures for whichµ+A ≥ µA ≥−µ−A for all A ∈ A. Remark. Note that the ...
Principles and Practice - Stephen Krashen
www.sdkrashen.com2. The natural order hypothesis 12 (a) Transitional forms 14 3. The Monitor hypothesis 15 (a) Individual variation in Monitor use 18 4. The input hypothesis 20 (a) Statement of the hypothesis 20 (b) Evidence supporting the hypothesis 22 5. The Affective Filter hypothesis 30 B. The Causative Variable in Second Language Acquisition 32 1.
The Lean Startup summary - Kim Hartman
www.kimhartman.seperform that rigorous testing without losing sight of the company´s overall vision. Leap-of-faith assumptions: The riskiest elements of a startup plan are the leap-of-faith assumptions. The two most important assumptions are the value hypothesis and the growth hypothesis.

STATISTICS PROJECT: Hypothesis Testing
commons.wvc.eduJul 12, 2006 · hypothesis testing. Project is accurate, interesting, and well-presented. Displays mastery of hypothesis testing. Project is accurate, creative, and well-presented. Hypothesis testing done at mastery level with meaningful connections throughout and a thorough summary and recommendation (I was “wowed”) 10 Draft and Edits 10 points
Using SPSS, Chapter 8: Hypothesis Testing - One Sample
cosmosweb.champlain.eduChapter 8.3 - Hypothesis Tests About a Mean: ˙Not Known (t-test) 2 SPSS does this really well but you do need the raw data. If you are working with summary statistics use one of the online calculators found here. Chapter 8.4 - Hypothesis Tests About a Mean: ˙Known SPSS doesn’t do this the same way it is done in the book.
Lecture 5 Hypothesis Testing in Multiple Linear Regression
courses.washington.eduknow this through hypothesis testing as confounders may not test significant but would still be necessary in the regression model). • Adding an unimportant predictor may increase the residual mean square thereby reducing the usefulness of the model.

Statistical Hypothesis Testing
www.afit.edusystem failure at least 3,000? Statistical hypothesis testing is a vehicle for answering these questions. Care must be taken in setting up the hypothesis test to ensure that the analysis performed addresses the test objective. Too often DoD testing includes “implied” hypothesis tests in which the actual hypotheses are never explicitly stated!

9: Basics of Hypothesis Testing - IIT Kanpur
www.cse.iitk.ac.in(Summary) Statistical hypothesis testing A. Hypothesis statements H 0: µ = µ 0 vs. H a: µ ≠ µ 0 (two-sided) or H a: µ < µ 0 (left-sided) or H a: µ > µ 0 (right-sided) B. Calculate Test statistic C. P-value: convert test statistic to p value D. Significance statement depending on α