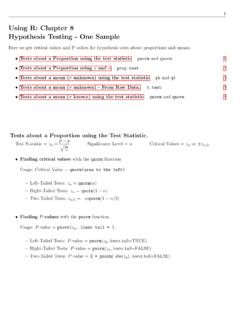
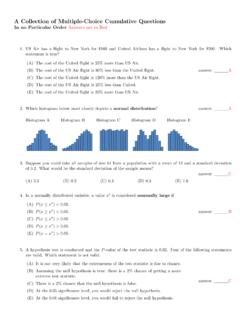
Transcription of Using R, Chapter 6: Normal Distributions pnorm and …
1 1. Using R, Chapter 6: Normal Distributions The pnorm and qnorm functions . Getting probabilities from a Normal distribution with mean and standard deviation . pnorm (x, mean = , sd = , ). If x is a normally distributed random variable, with mean = and standard deviation = , then P (x < xmax ) = pnorm (xmax , mean = , sd = , ). P (x > xmin ) = pnorm (xmin , mean = , sd = , ). P (xmin < x < xmax ) = pnorm (xmax , mean = , sd = , ). - pnorm (xmin , mean = , sd = , ). Examples: Suppose IQ's are normally distributed with a mean of 100 and a standard deviation of 15.
2 1. What percentage of people have an IQ less than 125? pnorm (125, mean = 100, sd = 15, ) = .9522 or about 95%. 2. What percentage of people have an IQ greater than 110? pnorm (110, mean = 100, sd = 15, ) = .2525 or about 25%. 3. What percentage of people have an IQ between 110 and 125? pnorm (125, mean = 100, sd = 15, ). - pnorm (110, mean = 100, sd = 15, ). = or about 20%. Usage for the standard Normal (z) distribution ( = 0 and = 1). In the text we first convert x scores to z scores Using the formula z = (x )/ and then find probabilities from the z-table.
3 These probabilities can be found with the pnorm function as well. It is actually the default values for and with the pnorm function. P (z < zmax ) = pnorm (zmax ). P (z > zmin ) = pnorm (zmin , ). P (zmin < z < zmax ) = pnorm (zmax ) - pnorm (xmin ). 2. Getting percentiles from a Normal distribution with mean and standard deviation . qnorm(lower tail area, mean= , sd = , ). Suppose you want to find the x-value that separates the bottom k% of the values from a distribution with mean and standard deviation . We denote this value in the text as Pk.
4 Pk = qnorm(k (in decimal form), mean = , sd = , ). P25 = qnorm(.25, mean = , sd = , ). P90 = qnorm(.90, mean = , sd = , ). Examples: Suppose IQ's are normally distributed with a mean of 100 and a standard deviation of 15. 1. What IQ separates the lower 25% from the others? (Find P25 .). P25 = qnorm(.25, mean = 100, sd = 15, ) = 2. What IQ separates the top 10% from the others? (Find P90 .). P90 = qnorm(.90, mean = 100, sd = 15, ) = Usage for the standard Normal (z) distribution ( = 0 and = 1). These are actually the default values for and in the qnorm function.
5 So getting z-scores is quite easy. Pk = qnorm(k (in decimal form)). P25 = qnorm(.25) = P90 = qnorm(.90) =