Transcription of Using SPSS, Chapter 9: Hypothesis Testing - Two Samples
1 1 Using spss , Chapter 9: Hypothesis Testing - Two Samples Chapter - Hypothesis Tests for Mean Differences: Paired Data2 spss does this really well but you do need the raw here for online calculators that work well with summary statistics. Chapter - Hypothesis Tests for Two Means: Independent Data4 spss does this really well but you do need the raw here for online calculators that work well with summary statistics. Chapter - Hypothesis Tests for Two Proportions6 spss doesn t do this the same way it is done in the here for online calculators that work well.
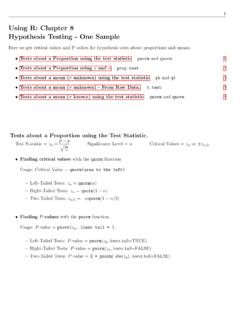
2 Creating and Importing Data71 Version 23 now can perform two-sample t-tests from summary statistics. The option is found under theCompare Meansmenu. I ll post instructions as soon as I get that version2 Chapter - Hypothesis Tests for Mean Differences: Paired Data Create/Open the data. In the Statistics Viewer chooseAnalyze Compare Means Paired- Samples T This opens another dialogue box. Transfer one variable toVariable 1and the other toVariable test statistic is based on (Variable 1) - (Variable 2).You can do more than one set of pairs but we ll keep it simple here.
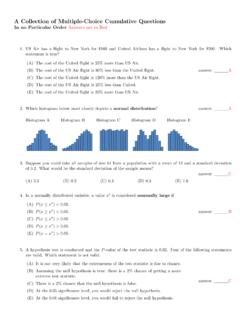
3 If you click , you can choose the confidence level for the confidence interval given in theresults. The results of this test are displayed in the Statistics Here, the two-tailedP-value is given as (it is actually ). If you were doing a one-tailed testyou would use half of this as theP-value. Regardless of whether we were performing a one or two-tailedtest, we would reject the null Hypothesis that the mean difference is zero. Using the confidence intervalapproach, we are 95% confident that the mean difference is between 21 and 43. If you want to test for a mean difference greater than zero,H1: 1 2> ,you will have to create another variable in your data set which is (Variable 1) - (Variable 2), then useaOne-Sample T Teston this variable of differences as described in Chapter spss will allow anon-zero hypothesized value with a one-sample test but not with a paired difference - Hypothesis Tests for Two Means: Independent Data Create/Open the sample data.
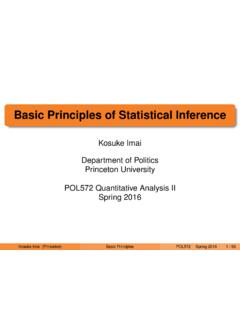
4 Be sure that each row corresponds to a single case. This means yourdifferent sample data will all be in one column where another column (variable) will determine thesample from which the measurement came. In the Statistics Viewer chooseAnalyze Compare Means Independent- Samples T This opens another dialogue box. choose the confidence level for the confidence interval given in the The results of this test are displayed in the Statistics Viewer. Here, the two-tailedP-value is given as Depending on your significance level you may or maynot reject the null Hypothesis of equal means.
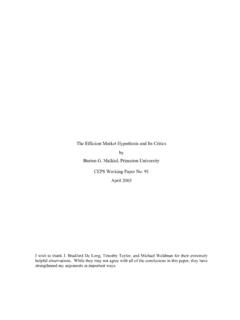
5 If you were doing a one-tailed test, theP-value wouldbe = Using the confidence interval approach, we are 95% confident that the differencein population means is between 5 and 59. That s a big interval. Notice, it doesn t matter whether weassume the variances are equal or unequal. Again, spss will only test that the difference in means is not equal to zero. You can t have a non-zerotest value like you can for the one-sample t-test. I don t know why. There is a way around this but itentails subtracting the hypothesized difference in means from all of the cases of the variable with thelarger - Hypothesis Tests for Two ProportionsSPSS doesn t do this test.
6 There are plenty of online calculators that will. Generally you only have toinput the proportion (or number) of successes and the sample size for each sample and hit a calculate buttonsomewhere. It will usually give you a test statistic (z) and like the collection of statistical calculators found at Social Science Click on the link a mental note of the variety of available statistical calculators. It s a useful collection. ChooseZ-test calculator for two population proportions. Click on theTake me to the calculator!button. Enter the number (or proportion in decimal) of successes (x) in the first sample.
7 Enter the size of the first sample. Do the same for the second sample. Choose your significance level. Choose one or two-tailed. Click on theCalculate Zbutton. It gives you the test statistic (Z-score) and theP-value in blue at the bottom of the page. Easy Peasy Lemon case this calculator disappears, there are others at the following fine locations. in-silico: UseEqualVariance. AusVet: VassarStats: and Importing Data There are two ways to get data into spss . You can enter the data by typing it directly into the data editor. You can open an existing data file by selecting theFiletab, thenOpen, select the type of file from the list of options.
8 If it is not already an spss (.sav) data file,you will be prompted to answer some questions. For example, if you open an Excel file it may askwhich worksheet and whether or not the first row contains labels. Make sure your data is formatted as described below. Rows = CasesEach row represents a case such as each respondent to a questionnaire. Columns = VariablesEach column represents a variable being tracked or measured. For example, the answers to a specificquestion on a questionnaire defines it s own variable (column). As such, each row represents anindividual case for all variables.
9 Cells contain valuesEach cell contains a single value of a variable for a is possible to enter data in the form of a frequency table but then you must do some alterationsbefore analyzing such data. Once you have the data opened in the data editor, click theVariable Viewtab at the bottom of thedata editor. In this view, each variable is now a row and you must make sure all your variables aredefined appropriately. The most important distinctions are TYPE: The most common types are Numeric: Used for quantitative data. These are numbers with no commas and a perioddelimiting the decimal places.
10 spss will not allow you to enter non-numeric characters into acell of numeric type. Date: Used for dates or times from a menu of formats. String: Used for qualitative data. Avoid symbols such as *, -, +, ?, etc. Measure: There are three levels of measurement. Scaleis for ratio or interval levels of measurement. Ordinalis for ordinal or ranked data. Nominalis for qualitative data. Values: If you have numeric values representing qualitative data such a 1=male and 0=female,you will probably want this to be labelled accordingly in graphs and outputs.