
Using SPSS, Chapter 9: Hypothesis Testing - Two Samples
Chapter 9.2 - Hypothesis Tests for Two Means: Independent Data 4 SPSS does this really well but you do need the raw data1. Click here for online calculators that work well with summary statistics. Chapter 9.3 - Hypothesis Tests for Two Proportions 6 SPSS doesn’t do this the same way it is done in the book.
Download Using SPSS, Chapter 9: Hypothesis Testing - Two Samples

Information
Domain:
Source:
Link to this page:
Documents from same domain
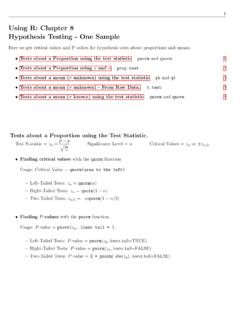
Using R: Chapter 8 Hypothesis Testing - One Sample
cosmosweb.champlain.eduUsing R: Chapter 8 Hypothesis Testing - One Sample Here we get critical values and P-values for hypothesis tests about proportions and means. Tests about a Proportion using the test statistic pnorm and qnorm. 1 Tests about a Proportion using xand n prop.test 2 Tests about a mean (˙unknown) using the test statistic pt and qt 3

Using SPSS, Chapter 8: Hypothesis Testing - One Sample
cosmosweb.champlain.eduChapter 8.3 - Hypothesis Tests About a Mean: ˙Not Known 1.Open or create your data. It must be in the form of rows=cases and columns=variables. SPSS can not be used with only the summarizing statistics (mean, standard deviation, sample size). Below left is the sample data. The sample mean is 38.6 and the sample standard deviation is 8.5. 2.

Using Excel, Chapter 8: Hypothesis Testing - One Sample
cosmosweb.champlain.eduChapter 8.2 - Hypothesis Testing About a Proportion Notation { Test Statistic = z ^p = p^ p q pq n { Signi cance Level = (in decimal form) { Critical Values = z or z =2 Finding Critical Values Here we use the NORM.S.INV function. NORM.S.INV stands for the inverse of the standard normal distribution (z-distribution).

Using R: Frequency Distributions, Histograms, Scatterplots ...
cosmosweb.champlain.eduThen we created a relative and cumulative frequency table from this. Frequency Distribution: Males Scores Frequency 30 - 39 1 40 - 49 3 50 - 59 5 60 - 69 9 70 - 79 6 80 - 89 10 90 - 99 8 Relative Frequency Distribution: Males Relative Scores 30 - 39 2.4% 40 - 49 7.1% 50 - 59 11.9% 60 - 69 21.4% 70 - 79 14.3% 80 - 89 23.8% 90 - 99 19.0% ...

Using R, Chapter 6: Normal Distributions pnorm and …
cosmosweb.champlain.edu1 Using R, Chapter 6: Normal Distributions The pnorm and qnorm functions. Getting probabilities from a normal distribution with mean and standard deviation ˙

Using the TI-83/84 Plus Chapter 8: Hypothesis Testing ...
cosmosweb.champlain.eduChapter 8: Hypothesis Testing - One Sample Here we see how to use the TI 83/84 to conduct hypothesis tests about proportions and means. The software will calculate the test statistic and the P-value for the test statistic. It does not give you the critical value.
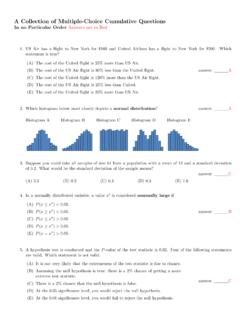
A Collection of Multiple-Choice Cumulative Questions In …
cosmosweb.champlain.eduA Collection of Past Questions Organized by Chapter Chapter 1: Sampling, Levels of Measurement, Percentages 1.A random sample is one with which characteristic? (A)Its members are chosen haphazardly. answer: (B)Every member of the population has an equal chance of being chosen for the sample.
Related documents
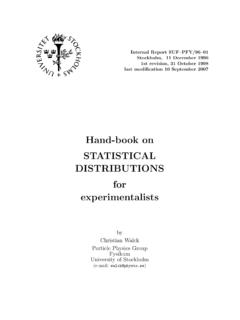
Hand-book on STATISTICAL DISTRIBUTIONS for …
www.stat.rice.eduInternal Report SUF–PFY/96–01 Stockholm, 11 December 1996 1st revision, 31 October 1998 last modification 10 September 2007 Hand-book on STATISTICAL
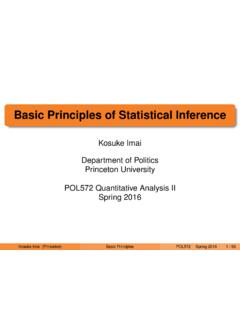
Basic Principles of Statistical Inference
imai.fas.harvard.eduStatistics for Social Scientists Quantitative social science research: 1 Find a substantive question 2 Construct theory and hypothesis 3 Design an empirical study and collect data 4 Use statistics to analyze data and test hypothesis 5 Report the results No study in the social sciences is perfect Use best available methods and data, but be aware of limitations

Hypothesis Testing Cheat Sheet - QI Macros
www.qimacros.comHypothesis testing uses statistical tests to determine if a hypothesis is true. The null hypothesis, H 0, is the statement that there IS NO statistically significant difference or relationship between variables. Any differences observed are due to chance. It is a statement of “no effect” or “no difference.”
The Efficient Market Hypothesis and its Critics
www.princeton.eduthem to reject the hypothesis that stock prices behave as random walks. There does seem to be some momentum in short-run stock prices. Moreover, Lo, Mamaysky and Wang (2000) also find, through the use of sophisticated nonparametric statistical techniques that
Reporting Results of Common Statistical Tests in APA Format
psych.uw.eduhypothesis. The results section should be in condensed format and lacking interpretation. Avoid discussing why or how the experiment was performed or alluding to whether your results are good or bad, expected or unexpected, interesting or uninteresting. This document is specifically about how to report statistical results.
American Statistical Association Releases Statement on ...
www.amstat.org5. A p-value, or statistical significance, does not measure the size of an effect or the importance of a result. 6. By itself, a p-value does not provide a good measure of evidence regarding a model or hypothesis. The statement has short paragraphs elaborating on each principle.

Alphabetical Statistical Symbols
www.statistics.comH-naught Null hypothesis. The null hypothesis is the hypothesis about the population parameter. Testing of hypothesis H 1 H-one Alternate hypothesis. An alternate hypothesis is constructed in such a way that it is the one to be accepted when the null hypothesis must be rejected. Testing of hypothesis IQR Interquartile range IQR = Q 3 -