Transcription of Using the TI-83/84 Plus Chapter 8: Hypothesis Testing ...
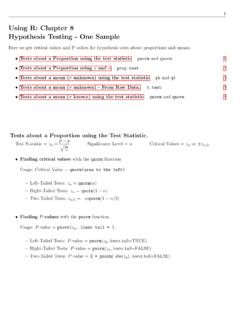
1 1 Using the TI-83/84 PlusChapter 8: Hypothesis Testing - One SampleHere we see how to use the TI 83/84 to conduct Hypothesis tests about proportions and means. The softwarewill calculate the test statistic and theP-value for the test statistic. It does not give you the critical tests about means, you can either input raw data via a list or simply enter the sample statistics. In allcases you will need to input a value from the null Hypothesis and whether the test is left, right, or of these test functions can be found by pressing theSTAT button and topic has its own page or you can go directly to the videos. Chapter - Tests about a Proportion1-PropZTest2 Play Video. Chapter - Tests about a Mean ( unknown)T-Test3 Play Video. Chapter - Tests about a Mean ( known)Z-Test4 Play Video. Entering Data Into Lists5 Play Tests about a Proportion:1-PropZTestPlay Press theSTAT button and Scroll down to5 You have to enter the proportion from the null Hypothesis (p0), the number of successes in the sample(x), the number of trials (or sample size) (n), then select two-tailed (prop6=p0), left-tailed (prop< p0)or right-tailed (prop> p0).
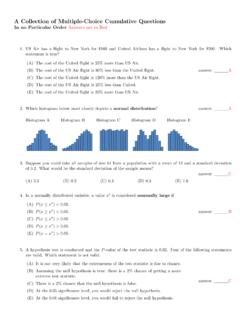
2 4. HighlightCalculateand hitENTER5. It gives you the test statistic (z) and theP-value for the test statistic (p) based on your choice oftwo-tailed, left-tailed, or right-tailed :TheP-value may be given in scientific 6= 10 6= :A coin used by the NFL to decide which team gets first pick at the beginning of a game is testedto see if it is fair. In 100 tosses there were 43 heads and 57 tails. The officials claim that this coin is a faircoin. Test their claim at the significance the proportion of heads inalltosses of the : p = : p = : p6= There:STATI nputOutputConclusion:Since theP-value ( ) is greater than ( ) we fail to reject the null Hypothesis . Thereis not enough data to reject the claim that the coin is Tests about a Mean ( unknown):T-TestPlay Press theSTAT button and Scroll down to2 HighlightDataorStats Data: If you chooseDatathe calculator does all the work but you have to enter the mean fromthe null Hypothesis ( 0and select two-tailed ( 6= 0), left-tailed ( < 0) or right-tailed ( > 0).)
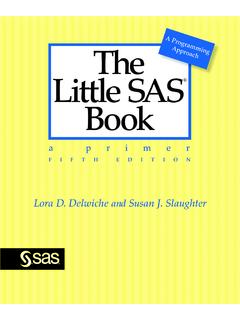
3 If your data is a standard list, setFreq:to 1. If your data is entered as a frequency distribution,put in the list which contains the frequencies. Stats: If you choose,Stats, you have to enter the mean from the null Hypothesis ( 0), the samplemean x, the sample standard deviation (sx), the sample size (n), and select two-tailed ( 6= 0),left-tailed ( < 0) or right-tailed ( > 0).4. HighlightCalculateand hitENTER5. It gives you the test statistic (t) and theP-value for the test statistic (p) based on your choice oftwo-tailed, left-tailed, or right-tailed test (so make sure you entered that correctly).Warning:TheP-value may be given in scientific 6= 10 6= :Carl the farmer has started Using organic fertilizer this year. The average weight of his tomatoeslast year was ounces. A sample of 40 tomatoes from this years crop reveals a mean weight of ounceswith a standard deviation of ounces.
4 Assume the weights are normally distributed. Use a significancelevel to test the claim that the mean weight of his tomatoes this year is different from the mean last represent the mean weight of this year s : 6= : = : 6= There:STATI nputOutputConclusion:Since theP-value ( ) is greater than ( ) we fail to reject the null is not enough data to support the claim that the mean weight of his tomatoes this year is differentfrom the mean last :When you do a left-tailed test theP-value is about which is less than and you can reject the null Tests about a Mean ( known):Z-TestPlay Press theSTAT button and Scroll down to1 HighlightDataorStats Data: If you chooseDatathe calculator does all the work but you have to enter the mean fromthe null Hypothesis ( 0), the population standard deviation ( ), and select two-tailed ( 6= 0),left-tailed ( < 0) or right-tailed ( > 0).
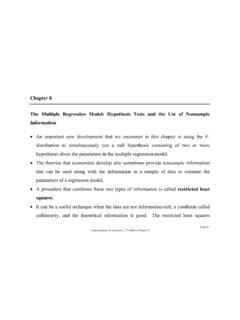
5 If your data is a standard list, setFreq:to 1. If yourdata is entered as a frequency distribution, put in the list which contains the frequencies. Stats: If you choose,Stats, you have to enter the mean from the null Hypothesis ( 0), thepopulation standard deviation ( ), the sample mean x, the sample size (n), and select two-tailed( 6= 0), left-tailed ( < 0) or right-tailed ( > 0).4. HighlightCalculateand hitENTER5. It gives you the test statistic (z) and theP-value for the test statistic (p) based on your choice oftwo-tailed, left-tailed, or right-tailed test (so make sure you entered that correctly).Warning:TheP-value may be given in scientific 6= 10 6= :It has been reported that the mean head circumference of adult males is cm with a stan-dard deviation of cm. In a study involving 63 randomly selected male college students, the mean headcircumference was cm.
6 At the significance level, test the claim that male college students havesmaller heads than the average adult male. Assume head circumferences are normally distributed and thepopulation standard deviation for male college students is the same as for adult males in represent the mean head circumference of all male college : < : = : < There:STATI nputOutputConclusion:Since theP-value ( 10 4 .0001354) is smaller than ( ) we reject the nullhypothesis. The sample data supports the claim that male college students have a mean head circumferencebelow the mean for adult Data into Lists:Play Press Highlight theEDIT option ( Using the arrows) and Choose a list (fromL1, L2,.., L6) Using the arrows and enter the values by the down-arrow to move down the You cancleara list by highlighting the list name and hitting theClearbutton.