Wilcoxon Signed-Rank Tests - Statistical Software
Power Calculation for the Wilcoxon Signed-Rank Test The power calculation for the Wilcoxon signed-rank test is the same as that for the one-sample t-test except that an adjustment is made to the sample size based on an assumed data distribution as described in Al-Sunduqchi and Guenther (1990).
Download Wilcoxon Signed-Rank Tests - Statistical Software

Information
Domain:
Source:
Link to this page:
Documents from same domain

Mixed Models - Repeated Measures - Statistical …
ncss-wpengine.netdna-ssl.comMixed Models – Repeated Measures Introduction ... analysis, and the amount of data available for the analysis. When more than one fixed factor may influence the

Repeated Measures Analysis - NCSS
ncss-wpengine.netdna-ssl.comThis section provides the technical details of the repeated measures designs that can be analyzed by PASS. Earlier ... Repeated Measures Analysis ...

Chapter 469 Decomposition Forecasting - NCSS
ncss-wpengine.netdna-ssl.comChapter 469 Decomposition Forecasting Introduction Classical time series decomposition separates a time series into five components: mean, long-range trend, seasonality, cycle, and randomness. The decomposition model is Value = (Mean) x (Trend) x (Seasonality) x (Cycle) x (Random).

Chapter 575 Probit Analysis - Statistical Software
ncss-wpengine.netdna-ssl.comChapter 575 Probit Analysis Introduction Probit Analysis is a method of analyzing the relationship between a stimulus (dose) and the quantal (all or nothing) response. Quantitative responses are almost always preferred, but in many situations they are not practical. In these cases, it is only possible to determine if a certain response (such as ...

Chapter 720 Probit Analysis - Statistical Software
ncss-wpengine.netdna-ssl.comChapter 720 Probit Analysis. Introduction . Probit and logit analysis may be used for comparative LD. 50. studies for testing the efficacy of drugs designed to prevent lethality. This program module presents calculates power and sample size using the methodology outlined

Chapter 311 Stepwise Regression - Statistical Software
ncss-wpengine.netdna-ssl.comNCSS Statistical Software NCSS.com © NCSS, LLC. All Rights Reserved.

Chapter 208 Paired T-Test - NCSS
ncss-wpengine.netdna-ssl.comNCSS Statistical Software NCSS.com Paired T-Test 208-6 © NCSS, LLC. All Rights Reserved. Tests Alpha Alpha is the significance leve l used in the hypothesis tests.

Multivariate Analysis of Variance (MANOVA)
ncss-wpengine.netdna-ssl.comNCSS Statistical Software NCSS.com Multivariate Analysis of Variance (MANOVA) 415-4 © NCSS, LLC. All Rights Reserved. Assumptions and Limitations

Chapter 194 Normality Tests - NCSS
ncss-wpengine.netdna-ssl.comNCSS Statistical Software NCSS.com © NCSS, LLC. All Rights Reserved.

Distribution Weibull Fitting - NCSS
ncss-wpengine.netdna-ssl.comDistribution (Weibull) Fitting Introduction This procedure estimates the parameters of the exponential, extreme value, logistic, log-logistic, lognormal, normal, and Weibull probability distributions by maximum likelihood. It can fit complete, right censored, left censored, interval censored (readou t), and grouped data values.
Related documents
14.1 The Wilcoxon Rank Sum Test - University of Florida
users.stat.ufl.edu14.1 The Wilcoxon Rank Sum Test 1 2 12 1 12 5 This test was invented by Frank Wilcoxon (1892–1965) in 1945. Wilcoxon was a chemist who met statistical problems in his work at the research laboratories of American Cyanimid Company. The Wilcoxon rank sum test The Wilcoxon Rank Sum Test
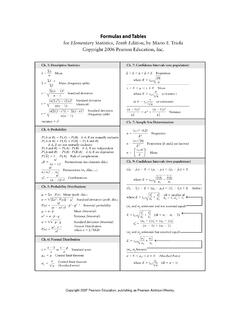
for Elementary Statistics, Tenth Edition, by Mario F ...
faculty.washington.eduRuns test for n 20 z 5 G 2m G s G 5 G 2 a 2n 1n 2 n 1 1 n 2 1 1b Å (2n 1n 2)(2n n 2 n 2 n ) ( n 1 1 2) 2 1 2 2 1) acritical value for n . 30: 6 z!n 2 1 b r s 5 1 2 6Sd2 n(n2 2 1) H 5 12 N(N 1 1) a R2 1 n 1 1 R2 2 n 2 1 . . . 1 R2 k n k b2 3(N 1 1) Wilcoxon rank-sum (two independent samples) z 5 R2m R s R 5 R2 n 1( 1 2 1) 2 Å n 1 2( 11) 12 ...

Types of Statistical Tests - University of Phoenix
research.phoenix.edu• Homogeneity of variance (Levene’s Test) • Interpretation: If the p value is less than.05, the results are significant • What to use if assumptions are not met: • Normality violated, use the Mann -Whitney or Wilcoxon Rank Sum • Homogeneity violated, use the second row of results on the t …

The NPAR1WAY Procedure - SAS
support.sas.comThe WILCOXON option produces the output inFigure 83.2. PROC NPAR1WAY first provides a summary of the Wilcoxon scores for the analysis variable Gain by class level. For each level of the CLASS variable Dose, PROC NPAR1WAY displays the following information: number of observations, sum of the Wilcoxon

Use Software R to do Survival Analysis and Simulation. A ...
www.ms.uky.edutest. 2. Two or more sample log-rank test. To test if the two samples are coming from the same distribution or two di erent distributions. (power is best for proportional hazard/Lehmann alternatives.) The relevant R function is survdiff(). There is also an option for ‘rho’. Rho = 0 (default) gives the log-rank test, rho=1 gives the Wilcoxon ...
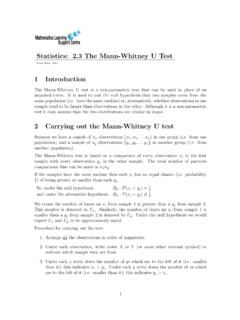
Statistics: 2.3 The Mann-Whitney U Test - statstutor
www.statstutor.ac.ukNote that the Mann-Whitney U test is statistically equivalent to the Wilcoxon rank sum test (not to be confused with the Wilcoxon signed rank sum test, which is for paired data). Example: The following data shows the age at diagnosis of type II diabetes in young adults. Is the age at diagnosis different for males and females? Males: 19 22 16 29 24