WORKSHEET – Extra examples
2.1 Frequency Distributions and Their Graphs Example 1: The following data set lists the midterm scores received by 50 students in a chemistry class: 45 85 92 99 37 68 67 78 81 25 97 100 82 49 54 78 89 71 94 87 21 77 81 83 98 97 74 81 39 77
Download WORKSHEET – Extra examples

Information
Domain:
Source:
Link to this page:
Documents from same domain
Systems of Differential Equations - Math
www.math.utah.edu522 Systems of Differential Equations Let x1(t), x2(t), x3(t) denote the amount of salt at time t in each tank. We suppose added to tank A water containing no salt. Therefore, the salt in all the tanks is eventually lost from the drains.
Laplace Transform - Home - Math
www.math.utah.eduLaplace Transform The Laplace transform can be used to solve di erential equations. Be-sides being a di erent and e cient alternative to variation of parame-ters and undetermined coe cients, the Laplace method is particularly advantageous for input terms that are piecewise-de ned, periodic or im-
Vector Calculus - Math
www.math.utah.eduCHAPTER 18 Vector Calculus In this chapter we develop the fundamental theorem of the Calculus in two and three dimensions. This begins with a slight reinterpretation of that theorem.
Second Order Linear Differential Equations
www.math.utah.edu12.2 Behavior of the Solutions 179 Example 12.6 Find the solution y y x of y 2y 5y 0, with the initial values y 0 2 y 0 1. The auxiliary equation r2 2r 5 0 has the solutions r
Second Order Linear Differential Equations - Math
www.math.utah.eduSecond Order Linear Differential Equations 12.1. Homogeneous Equations A differential equation is a relation involvingvariables x y y y . A solution is a function f x such that the substitution y f x y f x y f x gives an identity. The differential equation is

Quadratic Equations By Factoring - Math
www.math.utah.eduSolving Quadratic Equations By Factoring Date_____ Period____ Solve each equation by factoring. 1) (3 n − 2)(4n ... If a quadratic equation cannot be factored then it will have at least one imaginary solution. False (Example, x2 = 10 )-2-Title: Quadratic Equations By Factoring

Magic Squares and Modular Arithmetic - Math
www.math.utah.eduIntroductory problems 1. Find a magic square of order three whose first row is 0 8 4 2. Find a magic square of order three whose first row is 1 8 3

Multivariable Mathematics with Maple
www.math.utah.eduMultivariable Mathematics with Maple Linear Algebra, Vector Calculus and Difierential Equations by James A. Carlson and Jennifer M. Johnson °c 1996 Prentice-Hall

LECTURE NOTES ON DONSKER’S THEOREM - Math
www.math.utah.eduLECTURE NOTES ON DONSKER’S THEOREM DAVARKHOSHNEVISAN ABSTRACT.Some course notes on Donsker’s theorem. These are for Math7880-1(“TopicsinProbability”),taughtattheDeparmentofMath-

9.3 Geometric Sequences and Series - math.utah.edu
www.math.utah.edu9.3 Geometric Sequences and Series In sections 9.3 you will learn to: • Recognize, write and find the nth terms of geometric sequences. ... • Use geometric sequences to model and solve real-life problems. A sequence a 1, a 2, a 3, ... ,a n is said to be geometric is the ratio between consecutive terms remains constant.
Related documents

Chapter 2: Frequency Distributions and Graphs (or making ...
math.ucdenver.eduCh2: Frequency Distributions and Graphs Santorico -Page 30 For quantitative variables we have grouped and ungrouped frequency distributions. An Ungrouped Frequency Distribution is a frequency distribution where each class is only one unit wide. Meaningful when the data does not take on many values.
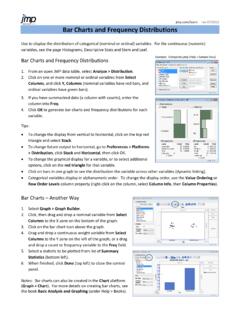
jmp.com/learn rev 07/2012 Bar Charts and Frequency ...
www.cs.uni.eduBar Charts and Frequency Distributions Use to display the distribution of categorical (nominal or ordinal) variables. For the continuous (numeric) variables, see the page Histograms, Descriptive Stats and Stem and Leaf. Bar Charts and Frequency Distributions 1. From an open JMP data table, select Analyze > Distribution. 2.

Using R: Frequency Distributions, Histograms, Scatterplots ...
cosmosweb.champlain.eduThen we created a relative and cumulative frequency table from this. Frequency Distribution: Males Scores Frequency 30 - 39 1 40 - 49 3 50 - 59 5 60 - 69 9 70 - 79 6 80 - 89 10 90 - 99 8 Relative Frequency Distribution: Males Relative Scores 30 - 39 2.4% 40 - 49 7.1% 50 - 59 11.9% 60 - 69 21.4% 70 - 79 14.3% 80 - 89 23.8% 90 - 99 19.0% ...
AP Statistics: Study Guide - EBSCO Connect
support.ebsco.comA relative frequency table gives the proportion of the total that is accounted for by each category. For example, in the previous data, 14 of the 50 cars, or 28%, were black. The full relative frequency table is as follows: Color Relative Frequency Black 28% Red 12% Blue 10% Silver 22% White 12% Green 6% Yellow 2% Grey 8%

in Public Health Practice
www.cdc.govNov 04, 2011 · Prepare and apply tables, graphs, and charts such as arithmetic-scale line, scatter diagram, pie chart, and box plot. Describe the processes, uses, …
Section 2.1, Frequency Distributions and Their Graphs
www.math.utah.eduSection 2.1, Frequency Distributions and Their Graphs The main characteristics we will use to describe a data set are its center, its variability, and its shape. One way to see patterns in data is to make a graph. In this section, we will look at 3 ways to graphically summarize data: frequency distributions, frequency histograms, and a cumulative
![Describing and Comparing Data Distributions [Teacher Version]](/cache/preview/4/8/8/1/a/a/7/d/thumb-4881aa7da51f684046f4244443a3c04f.jpg)
Describing and Comparing Data Distributions [Teacher Version]
www2.census.govdifferent levels (city or town, county, and state) to compare and contrast the distributions of these variables in graphs, analyzing the shape, center, and spread of each. Suggested Grade Level: 9 Approximate Time Required: ... • Frequency – the number of times a value occurs in a data set • Interquartile range (IQR) – a measure of ...
Frequency Distributions - University of Notre Dame
www3.nd.eduFrequency Table or Frequency Distribution Example: Data Set 1 Here are frequency distributions for the data on eye color and number of pets owned. (Note that we lose some information from our original data set by separating the data) Eye Color # of Students (Category) ( Frequency) Blue 4 Brown 6 Gray 2 Hazel 5 Green 3 Total 20 # Pets # of Students