Example: tourism industry
Table of ConTenTs
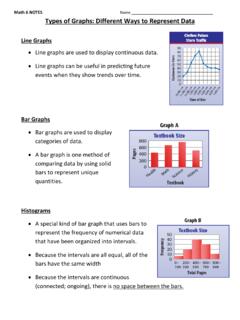
The most important part of your graph is the information, or data, it contains. Bar graphs can present data in many ways and can present more than one group of data at a time. The graph on the left is a regular bar graph with one group of data. The center graph has two groups of data that are stacked.
Tags:
Information
Domain:
Source:
Link to this page:
Documents from same domain

STATS IN BRIEF Public 2-year educational
nces.ed.govemployment before, during, and after their postsecondary enrollment. 4. 4 Although students may eventually earn a certificate or degree more than 3 years after first beginning postsecondary education, 3-year degree attainment is the only outcome measure available in the BPS:12/14 data.

Restricted-Use Data Procedures Manual
nces.ed.govRestricted-Use Data Procedures Manual U.S. Department of Education Institute of Education Sciences National Center for Education Statistics IES Data Security Office
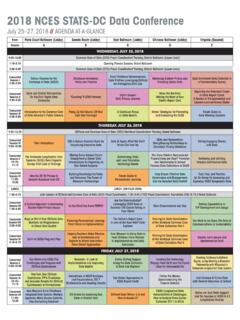
2018 NCES STATS-DC Data Conference
nces.ed.gov2018 NCES STATS-DC Data Conference July 25–27, 2018 Session I Session II // AGENDA AT-A-GLANCE Room Palm Court Ballroom (Lobby)

Architectural Design and Best Practices Project Final ...
nces.ed.govinterviews and best practices case studies that were presented to the Virginia Department of Education between October 2010 and Decem The Architectural Best Practices Report (A0 a list of candidate SLDS and large data integr published analyses, reports, and case studies ber 2010. 004) focused on initial data sourcing, both to develop
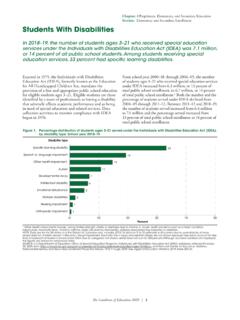
Children and Youth With Disabilities
nces.ed.govEnacted in 1975, the Individuals with Disabilities Education Act (IDEA), formerly known as the Education for All Handicapped Children Act, mandates the provision of a free and appropriate public school education for eligible students ages 3–21. Eligible students are those ... Children and Youth With Disabilities
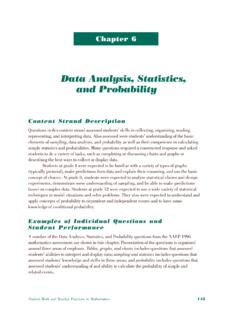
Data Analysis, Statistics, and Probability
nces.ed.gov(The probability was 74 percent for a 4-option multiple-choice question and 72 percent for a 5-option multiple-choice question.) Only selected questions are presented. The number 4, 8, or 12 in parentheses is the grade level at which the question was asked.

Financial Accounting for Local and State School …
nces.ed.govFinancial Accounting for . Local and State School Systems: 2014 Edition. NCES 2015-347. U.S. DEPARTMENT OF EDUCATION
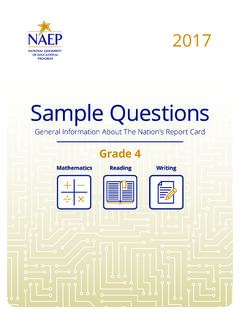
National Assessment of Educational Progress: 2017 …
nces.ed.govNational Assessment of Educational Progress 2017 Grade 4 Sample Questions Booklet I. About This Sample Questions Booklet ..... 3

U.S. Department of Education Office of Educational ...
nces.ed.govOffice of Educational Research and Improvement U.S. Department of Education Richard W. Riley ... local school system administrators realize the value of having well- ... accounting principles (GAAP), 1 a uniform minimum standard of. and guidelines for financial accounting and reporting. For LEA's,
National Assessment of Educational Progress: 2017 Grade 8 ...
nces.ed.govThis booklet includes the NAEP 2017 survey questionnaires for grade 8 for mathematics, reading, and writing, as well as sample questions for these three subjects in …
Related documents
Math 6 NOTES Name Types of Graphs: Different Ways to ...
www.lcps.orgMake a bar graph of the data. Compare the number of students in jazz class with the number in ballet class. Step 1 Decide on the scale and interval. Step 2 Label the horizontal and vertical axes. Step 3 Draw bars for each style. Step 4 Label the graph with a title. About twice as many students take ballet as take jazz. Make a line graph of the ...

Power of the Pyramids - Population Education
populationeducation.orgStudents should complete these calculations for each cohort. 3. Model how to construct a population pyramid. You may want to project a blank sheet of Pyramid Graph Paper with a data sheet on the board using a document camera or Smartboard. 4. Students construct a population pyramid for their assigned country by graphing the percentage data onto the

Self-Efficacy Assessment Suite Technical Report
www.researchcollaboration.orggraph of students’ scores on each component and self-efficacy overall, which is followed by a breakdown of student responses. The last section provides students’ responses to the essay question: ... data-driven decision-making to increase their students’ abilities to focus on their effort, progress, and learning . Erickson

ATLAS-Looking at Data Protocol - The To&Through Project
toandthrough.uchicago.eduLooking at Data Learning from Data is a tool to guide groups of teachers discovering what students, educators, and the public understand and how they are thinking. The tool, developed by Eric Buchovecky, is based in part on the work of the Leadership for Urban Mathematics Project and the Assessment Communities of Teachers Project.
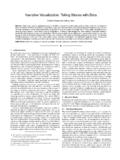
Narrative Visualization: Telling Stories with Data
vis.stanford.eduNarrative Visualization: Telling Stories with Data Edward Segel and Jeffrey Heer Abstract—Data visualization is regularly promoted for its ability to reveal stories within data, yet these “data stories” differ in important ways from traditional forms of storytelling. Storytellers, especially online journalists, have increasingly been integrating visualizations

Data-Based Individualization - Intensive Intervention
intensiveintervention.org2 Data-Based Individualization: A Framework for Intensive Intervention In terms of multi-tiered intervention frameworks, students with disabilities and other students referred for intensive intervention have been insufficiently responsive to the core instruction afforded all students (Agodini et al., 2009) and have also responded inadequately to
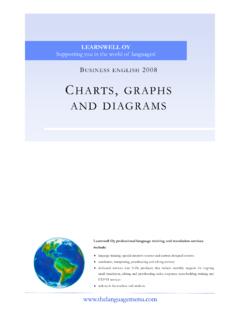
LEARNWELL OY
www.ilc.cuhk.edu.hkCircle and highlight the graph. Use arrows. Make notes. Circle the biggest, the smallest. stable or unchanging parts, sudden increases, etc. Identify trends. A trend is the overall idea of the graph • what is happening/what happened • the main change over time • the most noticeable thing about the graph • the pattern over time