Transcription of Chapter 8 Sampling Distribution Ch 8.1 Distribution of ...
1 1 Chapter 8 Sampling Distribution Ch Distribution of Sample Mean Objective A: Shape, Center, and Spread of the Distributions of x A1. Sampling Distributions of Mean Sampling Distribution of the Sample Mean: Normal Population Example 1: IQ is a measurement of intelligence derived from the Stanford Binet IQ test. Scores on this test are normally distributed with a mean score of 100 and a standard deviation of 15. (a) (i) Use StatCrunch to simulate 1000 random samples of size 10n from this population. StatCrunch -->StatCrunch Website -->Open StatCrunch --> Data --> Simulate --> Normal Click Options and Save.
2 Explain the representation of entries in row 1 of the StatCrunch spreadsheet. The entries in row one represent the set of randomly selected IQ s of 10 people. 2 (ii) Use StatCrunch to calculate the sample mean for each random sample of size10n . Stat --> Summary Stats --> Rows ---> Select all Normal1 to Normal10 for Select column(s) --> Select Mean for Statistics --> Check Store in data table --> Compute! Explain the representation of entries in column 11 of the StatCrunch spreadsheet. Column 11 entries represent the mean for the 10 IQ scores in row 10.
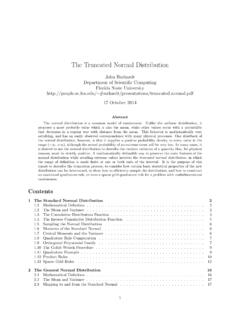
3 (iii) Use StatCrunch to draw a histogram for the 1000 sample means. What is the Sampling Distribution of the sample means of sample size n= 10? Let's use a lower class limit of the first class of 65 and a class width of 5. Graph --> Histogram --> Select Row Mean for Select column(s) --> Input Start at: 65 and Width: 5 for Bins ---> Compute ---> Options ---> Save. 3 Sketch the histogram and comment on the shape of the Distribution . The shape of the Distribution of x that came from a normally distributed population with 10 n is approximately normally distributed.
4 4 (b) Use StatCrunch to find the mean and standard deviation of the Sampling Distribution of the 1000 sample means? Stat ---> Summary Stats ----> Columns ---> Select Row Mean ---> Select Mean and Std. > for Statistics ---> Compute! Summary statistics: Column Mean Std. dev. Row Mean Write down the results. x = = (c) Repeat part (a) and (b) with size 40 n.
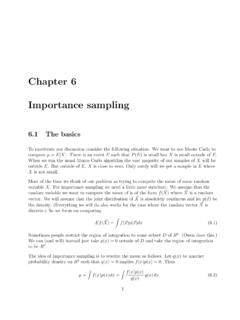
5 Sketch the histogram and comment on the shape of the Distribution . 5 For 40 nmost of the data is closer to the mean of 100 than it was in part (a) when 10 n. The shape of the Distribution of x that came from a normally distributed population with 40 n is approximately normally distributed. Summary statistics: Write down the results for x = = The Standard deviation has decreased to about half as much as when10 n.
6 A1. Sampling Distributions of Mean Sampling Distribution of the Sample Mean: Non-normal Population Example 1: The waiting time in line can be modeled by an exponential Distribution which is similar to skewed to the right with a mean of 5 minutes and a standard deviation of 5 minutes. (a) Repeat Example 1 of or part (a) but using exponential Distribution instead of normal Distribution . StatCrunch -->StatCrunch Website -->Open StatCrunch --> Data --> Simulate -->Exponential, then follow the steps given in (i) to (iii) to construct a histogram. If you are not sure about the start at value and the class width, just leave them blank and StatCrunch will figure it out based on the 1000 sample means.
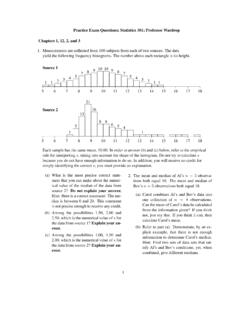
7 Sketch the histogram and comment on the shape of the Distribution . Column Mean Std. dev. Row Mean 6 StatCrunch -->StatCrunch Website -->Open StatCrunch --> Data --> Simulate --> Exponential Stat --> Summary Stats --> Rows ---> Select all Exponential1 to Exponential10 for Select column(s) --> Select Mean for Statistics --> Check Store in data table --> Compute!. Graph --> Histogram --> Select Row Mean for Select column(s) --> Leave Bins: as optional --> --> Compute!
8 7 The shape of the Distribution of x that came from a non-normally distributed population (exponential Distribution is skewed to the right) with10 n is approximately right skewed. 8 (b) Repeat Example 1 of of part (b) using the sample means obtained from of part (a). Write down the results. Stat ---> Summary Stats ----> Columns ---> Select Row Mean ---> Select Mean and Std.
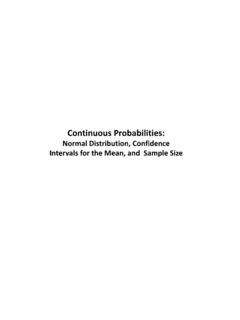
9 > for Statistics ---> Compute! x = x = (c) Repeat part (a) and (b) with size40 n. Sketch the histogram and comment on the shape of the Distribution . (In order to compare the Distribution shape of x for 10 n versus 40 n, we will use the same starting point of 0 and bin width of 2) 9 The shape of the Distribution of x that came from a non-normally distributed population (exponential Distribution is skewed to the right) with40 n is approximately normally distributed.
10 Write down the results for x = and x = A2. Central Limit Theorem A. If the population Distribution of xis normally distributed, the Sampling Distribution ofx is normally distributed regardless of the sample sizen. If the population Distribution xis not normally distributed, the Sampling Distribution of xis guaranteed to be normally distributed if 30n . Use the Distribution shapes obtained from the two simulation Example 1results of objective A1 to verify the statement A of the Central Limit Theorem.