Transcription of Distributions of Residence Times for Chemical …
1 867 13 Distributionsof Residence Timesfor Chemical Reactors Nothing in life is to be feared. It is only to be CurieOverview In this chapter we learn about nonideal reactors, that is, reactorsthat do not follow the models we have developed for ideal CSTRs, PFRs,and PBRs. In Part 1 we describe how to characterize these nonideal reactorsusing the Residence time distribution function E(t), the mean Residence timetm, the cumulative distribution function F(t), and the variance 2. Next weevaluate E(t), F(t), tm, and 2 for ideal reactors, so that we have a referencepoint as to how far our real ( , nonideal) reactor is off the norm from anideal reactor.
2 The functions E(t) and F(t) will be developed for ideal PPRs,CSTRs and laminar flow reactors. Examples are given for diagnosing prob-lems with real reactors by comparing tm and E(t) with ideal reactors. Wewill then use these ideal curves to help diagnose and troubleshoot bypassingand dead volume in real Part 2 we will learn how to use the Residence time data and functionsto make predictions of conversion and exit concentrations. Because the resi-dence time distribution is not unique for a given reaction system, we mustuse new models if we want to predict the conversion in our nonideal present the five most common models to predict conversion and thenclose the chapter by applying two of these models, the segregation modeland the maximum mixedness model, to single and to multiple studying this chapter the reader will be able to describe thecumulative F(t) and external age E(t)
3 And Residence - time distribution functions,and to recognize these functions for PFR, CSTR, and laminar flow reader will also be able to apply these functions to calculate the conver-sion and concentrations exiting a reactor using the segregation model andthe maximum mixedness model for both single and multiple reactions. Page 867 Wednesday, September 17, 2008 5:01 PM 868 Distributions of Residence Times for Chemical ReactorsChap. 13 General Characteristics The reactors treated in the book thus far the perfectly mixed batch, theplug-flow tubular, the packed bed, and the perfectly mixed continuous tankreactors have been modeled as ideal reactors.
4 Unfortunately, in the real worldwe often observe behavior very different from that expected from the exem-plar; this behavior is true of students, engineers, college professors, and chem-ical reactors. Just as we must learn to work with people who are not perfect,so the reactor analyst must learn to diagnose and handle Chemical reactorswhose performance deviates from the ideal. Nonideal reactors and the princi-ples behind their analysis form the subject of this chapter and the next. Part 1 Characterization and Diagnostics The basic ideas that are used in the distribution of Residence Times to charac-terize and model nonideal reactions are really few in number.
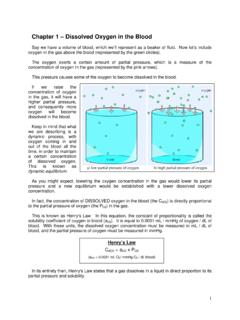
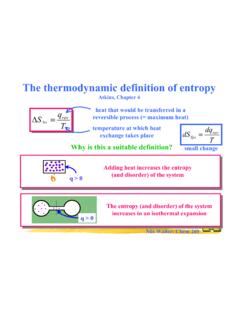
5 The two majoruses of the Residence time distribution to characterize nonideal reactors are1. To diagnose problems of reactors in operation2. To predict conversion or effluent concentrations in existing/availablereactors when a new reaction is used in the reactor System 1 In a gas liquid continuous-stirred tank reactor (Figure 13-1), thegaseous reactant was bubbled into the reactor while the liquid reactant was fedthrough an inlet tube in the reactor s side. The reaction took place at thegas liquid interface of the bubbles, and the product was a liquid.
6 The continu-ous liquid phase could be regarded as perfectly mixed, and the reaction ratewas proportional to the total bubble surface area. The surface area of a partic-ular bubble depended on the time it had spent in the reactor. Because of theirdifferent sizes, some gas bubbles escaped from the reactor almost immediately,while others spent so much time in the reactor that they were almost com-We want to analyzeand characterizenonideal 13-1 Gas liquid reactor. Page 868 Wednesday, September 17, 2008 5:01 PM Sec. Characteristics 869 pletely consumed.
7 The time the bubble spends in the reactor is termed the bub-ble Residence time . What was important in the analysis of this reactor was notthe average Residence time of the bubbles but rather the Residence time of eachbubble ( , the Residence time distribution ). The total reaction rate was foundby summing over all the bubbles in the reactor. For this sum, the distributionof Residence Times of the bubbles leaving the reactor was required. An under-standing of Residence - time Distributions (RTDs) and their effects on chemicalreactor performance is thus one of the necessities of the technically competentreactor analyst.
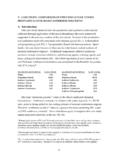
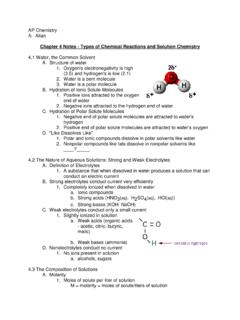
8 System 2 A packed-bed reactor is shown in Figure 13-2. When a reactor ispacked with catalyst, the reacting fluid usually does not flow through the reac-tor uniformly. Rather, there may be sections in the packed bed that offer littleresistance to flow, and as a result a major portion of the fluid may channelthrough this pathway. Consequently, the molecules following this pathway donot spend as much time in the reactor as those flowing through the regions ofhigh resistance to flow. We see that there is a distribution of Times that mole-cules spend in the reactor in contact with the catalyst.
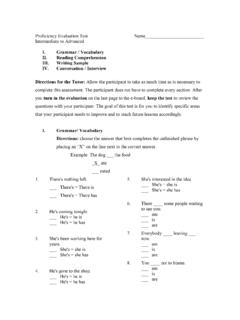
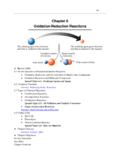
9 System 3 In many continuous-stirred tank reactors, the inlet and outlet pipesare close together (Figure 13-3). In one operation it was desired to scale uppilot plant results to a much larger system. It was realized that some short cir-cuiting occurred, so the tanks were modeled as perfectly mixed CSTRs with abypass stream. In addition to short circuiting, stagnant regions (dead zones) areoften encountered. In these regions there is little or no exchange of materialwith the well-mixed regions, and, consequently, virtually no reaction occursNot all moleculesare spending thesame time in 13-2 Packed-bed want to findways ofdetermining thedead volume andamount 13-3 CSTR.
10 Page 869 Wednesday, September 17, 2008 5:01 PM 870 Distributions of Residence Times for Chemical ReactorsChap. 13 there. Experiments were carried out to determine the amount of the materialeffectively bypassed and the volume of the dead zone. A simple modificationof an ideal reactor successfully modeled the essential physical characteristicsof the system and the equations were readily concepts were used to describe nonideal reactors in these exam-ples: the distribution of Residence Times in the system, the quality of mixing ,and the model used to describe the system.