Transcription of GARLIC COMMODITY PROFILE - Minister of …
1 A PROFILE OF THE SOUTH AFRICAN GARLIC MARKET VALUE CHAIN 2010 Directorate Marketing Private Bag X15 ARCADIA 0007 Tel: 012 319 8455/6 Fax: 012 319 8131 Email: 2 TABLE OF CONTENTS 1. DESCRIPTION OF THE INDUSTRY 3 Production Areas 3 2. MARKET STRUCTURE 4 Domestic market and Prices 4 Exports 5 Share analysis 11
2 South Africa GARLIC imports 13 Processing 16 GARLIC value chain tree explaining its uses 17 Market value Chain for GARLIC 18 3. MARKET INTELLIGENCE 19 Tariffs 19 Non tariff barriers 22 4.
3 GENERAL DISTRIBUTION CHANNELS 24 5. LOGISTICAL ISSUES 25 Mode of transport 25 Cold chain management 25 Packaging 25
4 6. COMPETITIVENESS OF SOUTH AFRICAN GARLIC EXPORTS 26 7. BUSINESS OPPORTUNITIES AND CHALLENGES 28 Opportunities 28 Challenges 28 ACKNOWLEDGEMENTS 29 1.
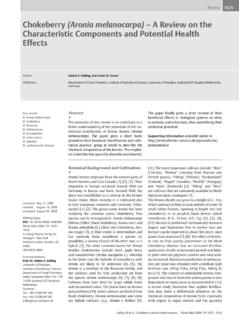
5 DESCRIPTION OF THE INDUSTRY GARLIC is a close relative of onion, leeks and chives. In size and growth habit, GARLIC resembles the onion. Besides onion, GARLIC is the most important bulb crop grown almost all over South Asia. It is widely used for flavoring and seasoning dishes, pickles and sauces. Large amount of GARLIC are produced in China and India. GARLIC has become an increasingly popular vegetable in recent years among producers, marketers and consumers. Its long acclaimed nutritional and medicinal values are proving to be valid. More people are discovering its culinary splendor, and producers have found GARLIC to be a potentially highly profitable crop. Figure 1: Gross value of production050000001000000015000000200000 0025000000300000002000200120022003200420 052006200720082009 YearsRand Source: Agricultural Statistics Figure 1 above, illustrate the contribution of GARLIC industry to the total gross production of agricultural industry over the period of 10 years.
6 The contribution of GARLIC industry has increased steadily from 2001 to 2007. In 2008, the gross value of production dropped by due to decline in production in the same production season. In 2009 the contribution increased by 7% when compare to the previous year. The highest GARLIC industry contribution was recorded in 2007 due to higher prices received by producers across the markets. Production Areas As a general rule, conditions suitable for onion production, are suitable for GARLIC production. The highest quality GARLIC is produced in the cool, dry regions of South Africa. These production areas include Limpopo Province in particular (Polokwane Plateau); North West Province, Gauteng ; northern, western and southern Free State province; part of Kwa-Zulu Natal; the Western Cape province (in particular the Karoo); as well as parts of the Northern Cape 3(Douglas area).
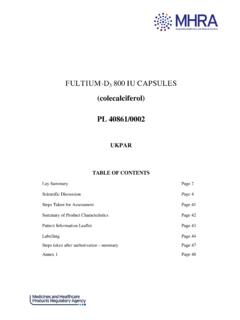
7 Globally, China followed by India, South Korea, and United States are top countries producing GARLIC . Figure 2 : Production of Garlic0500100015002000250030002000200120 022003200420052006200720082009 YearsTons Source: Agricultural Statistics GARLIC production has been fairly unsteady for the period under review . In 2001 the production dropped by 24% compared to tons produced in the year 2000. The production started to increase again in 2002 to 2003 and then the production started to decline steadily from 2004 to 2006. In 2009 the production volumes increased by 18% when compared with 2008 production season. The drop in production can be attributed to the unfavorable climatic conditions, and South African producers having to compete with cheaper GARLIC imports from the world where production costs are much lower.
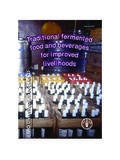
8 2. MARKET STRUCTURE Domestic market and Prices In South Africa GARLIC is sold through different marketing channels such as the National Fresh Produce Market, hawkers, directly to the retailers, restaurants and processors. GARLIC is marketed as a fresh product, dehydrated or as certified seeds. GARLIC is also exported to other countries through exports agents and marketing companies. Most of commercial GARLIC production is grown under contract between grower and buyer. SA has a limited market for GARLIC ; South Africa consumes only 3000 tons of GARLIC per annum. 4 Figure 3: GARLIC sales at fresh produce markets050010001500200025003000200020012 0022003200420052006200720082009 YearsTons0200040006000800010000120001400 016000 RandVolume (tons)Rand/ton Source: Agricultural Statistics Figure 3 above; illustrate the sales of GARLIC in the national fresh produce markets in the past ten years.
9 There were relative fluctuations in the volumes and prices of GARLIC sold in the major fresh produce markets. The prices were very low in 2000 and 2003 due to high volumes across the markets. The general trend observed is that prices increase substantially when few volumes are supplied to the markets. The highest volume was supplied in 2003 and the price was 10% lower compared to 2002 GARLIC price. Prices eased marginally higher from 2004 to 2008 as volumes declines significantly across the markets. In 2009 the prices eased lower by 9% as volumes increases across the market. Exports South Africa is not a major GARLIC exporter, it represents of world exports for this product, and its ranking in world GARLIC exports is 34. In the past five years South Africa exported GARLIC to the following countries: Angola, Netherlands, Zimbabwe, Germany, Mozambique, Congo, Democratic Republic of Congo, United States of America, Malawi and Saint Helena.
10 China is ranked number one in the world GARLIC exporters followed by Spain and Argentina respectively. Figure 4 below, illustrate major destinations of exported GARLIC in 2009. 5 Figure 5: South Africa GARLIC export destination in m stores and Source: Trade Map Table 1: South Africa s GARLIC exports in 2009 Importers Exported value 2009, USD thousand Share in South Africa's exports, % Exported quantity 2009 (tons) Unit value, (USD/ unit) Exported growth in value between 2005-2009, %, Exported growth in quantity between 2005- 2009, %, Exported growth in value between 2008-2009, %, World 423 100 282 1500 17 7 9 Angola 99 83 1193 6 -5 136 Netherlands 98 36 2722 37 58 9 Ship stores and bunkers 92 36 2556 17 21 -36 Zimbabwe 64 99 646 25 24 540 Germany 18 7 2571 39 -16 -44 Mozambique 15