Transcription of Forecasting time series using R - Rob J Hyndman
1 Forecasting time series using R1 Forecasting time seriesusing RProfessor Rob J Hyndman27 October 2011 Forecasting time series using RTime series in R2 Outline1 time series in R2 Some simple Forecasting methods3 Measuring forecast accuracy4 Exponential smoothing5 Box-Cox transformations6 ARIMA forecasting7 Difficult seasonality8forecast() function9 time series cross-validationForecasting time series using RTime series in R3 Australian GDPausgdp <- ts(scan(" "),frequency=4,start=1971+2/4)Class:tsPrint and plotting methods available.> ausgdpQtr1 Qtr2 Qtr3 Qtr41971 4612 46511972 4645 4615 4645 47221973 4780 4830 4887 49331974 4921 4875 4867 49051975 4938 4934 4942 49791976 5028 5079 5112 51271977 5130 5101 5072 50691978 5100 5166 5244 53121979 5349 5370 5388 53961980 5388 5403 5442 5482 Forecasting time series using RTime series in R3 Australian GDPausgdp <- ts(scan(" "),frequency=4,start=1971+2/4)Class:tsPr int and plotting methods available.
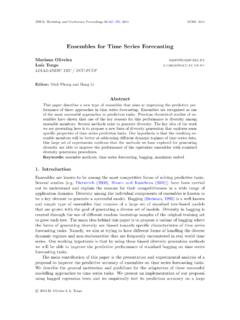
2 > ausgdpQtr1 Qtr2 Qtr3 Qtr41971 4612 46511972 4645 4615 4645 47221973 4780 4830 4887 49331974 4921 4875 4867 49051975 4938 4934 4942 49791976 5028 5079 5112 51271977 5130 5101 5072 50691978 5100 5166 5244 53121979 5349 5370 5388 53961980 5388 5403 5442 5482 Forecasting time series using RTime series in R3 Australian GDPausgdp <- ts(scan(" "),frequency=4,start=1971+2/4)Class:tsPrint and plotting methods available.> ausgdpQtr1 Qtr2 Qtr3 Qtr41971 4612 46511972 4645 4615 4645 47221973 4780 4830 4887 49331974 4921 4875 4867 49051975 4938 4934 4942 49791976 5028 5079 5112 51271977 5130 5101 5072 50691978 5100 5166 5244 53121979 5349 5370 5388 53961980 5388 5403 5442 5482 Forecasting time series using RTime series in R4 Australian GDPT imeausgdp1975198019851990199545005000550 06000650070007500> plot(ausgdp) Forecasting time series using RTime series in R5 Residential electricity sales> elecsalesTime series :Start = 1989 End = 2008 Frequency = 1[1] [7] [13] [19] time series using RTime series in R6 Useful packagesTime series task view: Forecasting functionstseriesfor unit root tests and GARCH modelsMcompfor the M-competition andM3-competition datafmafor data from Makridakis,Wheelwright & Hyndman (1998)expsmoothfor data from Hyndman et al.
3 (2008)fppfor data from Hyndman &Athanasopoulos (forthcoming). Forecasting time series using RTime series in R6 Useful packagesTime series task view: Forecasting functionstseriesfor unit root tests and GARCH modelsMcompfor the M-competition andM3-competition datafmafor data from Makridakis,Wheelwright & Hyndman (1998)expsmoothfor data from Hyndman et al. (2008)fppfor data from Hyndman &Athanasopoulos (forthcoming). Forecasting time series using RSome simple Forecasting methods7 Outline1 time series in R2 Some simple Forecasting methods3 Measuring forecast accuracy4 Exponential smoothing5 Box-Cox transformations6 ARIMA forecasting7 Difficult seasonality8forecast() function9 time series cross-validationForecasting time series using RSome simple Forecasting methods8 Some simple Forecasting methodsMean methodForecast of all future values isequal to mean of historical data{y1,..,yn}.Forecasts: yn+h|n= y= (y1+ +yn)/nForecasting time series using RSome simple Forecasting methods8 Some simple Forecasting methodsMean methodForecast of all future values isequal to mean of historical data{y1.}
4 ,yn}.Forecasts: yn+h|n= y= (y1+ +yn)/nForecasting time series using RSome simple Forecasting methods9 Some simple Forecasting methodsNa ve methodForecasts equal to last : yn+h|n= for efficient stock time series using RSome simple Forecasting methods9 Some simple Forecasting methodsNa ve methodForecasts equal to last : yn+h|n= for efficient stock time series using RSome simple Forecasting methods9 Some simple Forecasting methodsNa ve methodForecasts equal to last : yn+h|n= for efficient stock time series using RSome simple Forecasting methods10 Some simple Forecasting methodsSeasonal na ve methodForecasts equal to last value fromsame : yn+h|n=yn mwherem=seasonal period andk=b(h 1)/mc+ time series using RSome simple Forecasting methods10 Some simple Forecasting methodsSeasonal na ve methodForecasts equal to last value fromsame : yn+h|n=yn mwherem=seasonal period andk=b(h 1)/mc+ time series using RSome simple Forecasting methods11 Some simple Forecasting methodsDrift methodForecasts equal to last value plus : yn+h|n=yn+hn 1n t=2(yt yt 1)=yn+hn 1(yn y1).
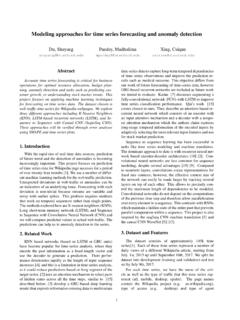
5 Equivalent to extrapolating a line drawnbetween first and last time series using RSome simple Forecasting methods11 Some simple Forecasting methodsDrift methodForecasts equal to last value plus : yn+h|n=yn+hn 1n t=2(yt yt 1)=yn+hn 1(yn y1).Equivalent to extrapolating a line drawnbetween first and last time series using RSome simple Forecasting methods11 Some simple Forecasting methodsDrift methodForecasts equal to last value plus : yn+h|n=yn+hn 1n t=2(yt yt 1)=yn+hn 1(yn y1).Equivalent to extrapolating a line drawnbetween first and last time series using RSome simple Forecasting methods12 Some simple Forecasting methodsAustralian annual beer productionYear19601970198019902000100012 001400160018002000 Forecasting time series using RSome simple Forecasting methods12 Some simple Forecasting methodsAustralian annual beer productionYear19601970198019902000100012 001400160018002000 Mean methodNaive methodDrift modelForecasting time series using RSome simple Forecasting methods13 Some simple Forecasting methodsMean:meanf(x,h=20)Naive:naive(x,h =20)orrwf(x,h=20)Seasonal naive:snaive(x,h=20)Drift:rwf(x,drift=TR UE,h=20) Forecasting time series using RSome simple Forecasting methods13 Some simple Forecasting methodsMean:meanf(x,h=20)Naive:naive(x,h =20)orrwf(x,h=20)Seasonal naive:snaive(x,h=20)Drift.
6 Rwf(x,drift=TRUE,h=20) Forecasting time series using RSome simple Forecasting methods13 Some simple Forecasting methodsMean:meanf(x,h=20)Naive:naive(x,h =20)orrwf(x,h=20)Seasonal naive:snaive(x,h=20)Drift:rwf(x,drift=TR UE,h=20) Forecasting time series using RSome simple Forecasting methods13 Some simple Forecasting methodsMean:meanf(x,h=20)Naive:naive(x,h =20)orrwf(x,h=20)Seasonal naive:snaive(x,h=20)Drift:rwf(x,drift=TR UE,h=20) Forecasting time series using RSome simple Forecasting methods14forecast objects in RFunctions that output aforecastobject:meanf()naive(),snaive()r wf()croston()stlf()ses()holt(),hw()splin efthetafforecast()forecast class containsOriginal seriesPoint forecastsPrediction intervalForecasting method usedResiduals and in-sample one-step forecastsForecasting time series using RSome simple Forecasting methods14forecast objects in RFunctions that output aforecastobject:meanf()naive(),snaive()r wf()croston()stlf()ses()holt(),hw()splin efthetafforecast()forecast class containsOriginal seriesPoint forecastsPrediction intervalForecasting method usedResiduals and in-sample one-step forecastsForecasting time series using RSome simple Forecasting methods14forecast objects in RFunctions that output aforecastobject:meanf()naive(),snaive()r wf()croston()stlf()ses()holt(),hw()splin efthetafforecast()forecast class containsOriginal seriesPoint forecastsPrediction intervalForecasting method usedResiduals and in-sample one-step forecastsForecasting time series using RSome simple Forecasting methods14forecast objects in RFunctions that output aforecastobject.
7 Meanf()naive(),snaive()rwf()croston()stl f()ses()holt(),hw()splinefthetafforecast ()forecast class containsOriginal seriesPoint forecastsPrediction intervalForecasting method usedResiduals and in-sample one-step forecastsForecasting time series using RSome simple Forecasting methods14forecast objects in RFunctions that output aforecastobject:meanf()naive(),snaive()r wf()croston()stlf()ses()holt(),hw()splin efthetafforecast()forecast class containsOriginal seriesPoint forecastsPrediction intervalForecasting method usedResiduals and in-sample one-step forecastsForecasting time series using RSome simple Forecasting methods14forecast objects in RFunctions that output aforecastobject:meanf()naive(),snaive()r wf()croston()stlf()ses()holt(),hw()splin efthetafforecast()forecast class containsOriginal seriesPoint forecastsPrediction intervalForecasting method usedResiduals and in-sample one-step forecastsForecasting time series using RMeasuring forecast accuracy15 Outline1 time series in R2 Some simple Forecasting methods3 Measuring forecast accuracy4 Exponential smoothing5 Box-Cox transformations6 ARIMA forecasting7 Difficult seasonality8forecast() function9 time series cross-validationForecasting time series using RMeasuring forecast accuracy16 Measures of forecast accuracyLetytdenote thetth observation andftdenote itsforecast, wheret=1.
8 ,n. Then the followingmeasures are 1n t=1|yt ft|MSE=n 1n t=1(yt ft)2 RMSE= n 1n t=1(yt ft)2 MAPE=100n 1n t=1|yt ft|/|yt|MAE, MSE, RMSE are all scale is scale independent but is only sensible ifyt 0 for alli, andyhas a natural time series using RMeasuring forecast accuracy16 Measures of forecast accuracyLetytdenote thetth observation andftdenote itsforecast, wheret=1,..,n. Then the followingmeasures are 1n t=1|yt ft|MSE=n 1n t=1(yt ft)2 RMSE= n 1n t=1(yt ft)2 MAPE=100n 1n t=1|yt ft|/|yt|MAE, MSE, RMSE are all scale is scale independent but is only sensible ifyt 0 for alli, andyhas a natural time series using RMeasuring forecast accuracy16 Measures of forecast accuracyLetytdenote thetth observation andftdenote itsforecast, wheret=1,..,n. Then the followingmeasures are 1n t=1|yt ft|MSE=n 1n t=1(yt ft)2 RMSE= n 1n t=1(yt ft)2 MAPE=100n 1n t=1|yt ft|/|yt|MAE, MSE, RMSE are all scale is scale independent but is only sensible ifyt 0 for alli, andyhas a natural time series using RMeasuring forecast accuracy17 Measures of forecast accuracyMean Absolute Scaled ErrorMASE=n 1n t=1|yt ft|/qwhereqis a stable measure of the scale of thetime series {yt}.
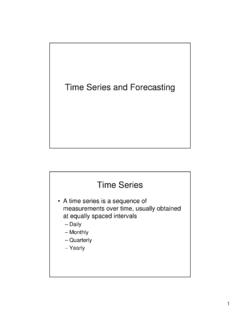
9 Forecasting time series using RMeasuring forecast accuracy17 Measures of forecast accuracyMean Absolute Scaled ErrorMASE=n 1n t=1|yt ft|/qwhereqis a stable measure of the scale of thetime series {yt}.Proposed by Hyndman and Koehler (IJF, 2006) Forecasting time series using RMeasuring forecast accuracy17 Measures of forecast accuracyMean Absolute Scaled ErrorMASE=n 1n t=1|yt ft|/qwhereqis a stable measure of the scale of thetime series {yt}.For non-seasonal time series ,q= (n 1) 1n t=2|yt yt 1|works well. Then MASE is equivalent to MAErelative to a naive time series using RMeasuring forecast accuracy17 Measures of forecast accuracyMean Absolute Scaled ErrorMASE=n 1n t=1|yt ft|/qwhereqis a stable measure of the scale of thetime series {yt}.For seasonal time series ,q= (n m) 1n t=m+1|yt yt m|works well. Then MASE is equivalent to MAErelative to a seasonal naive time series using RMeasuring forecast accuracy18 Measures of forecast accuracyAustralian annual beer productionYear19601970198019902000100012 001400160018002000 Mean methodNaive methodDrift modelForecasting time series using RMeasuring forecast accuracy18 Measures of forecast accuracyAustralian annual beer productionYear19601970198019902000100012 001400160018002000 Mean methodNaive methodDrift modelForecasting time series using RMeasuring forecast accuracy19 Measures of forecast accuracyMean methodRMSE MAE MAPE ve methodRMSE MAE MAPE methodRMSE MAE MAPE time series using RExponential smoothing20 Outline1 time series in R2 Some simple Forecasting methods3 Measuring forecast accuracy4 Exponential smoothing5 Box-Cox transformations6 ARIMA forecasting7
10 Difficult seasonality8forecast() function9 time series cross-validationForecasting time series using RExponential smoothing21 Exponential smoothingClassic ReferenceMakridakis, Wheelwright andHyndman (1998) Forecasting :methods and applications, 3rded., Wiley: ReferenceHyndman, Koehler, Ord andSnyder (2008) Forecasting withexponential smoothing: thestate space approach,Springer-Verlag: time series using RExponential smoothing21 Exponential smoothingClassic ReferenceMakridakis, Wheelwright andHyndman (1998) Forecasting :methods and applications, 3rded., Wiley: ReferenceHyndman, Koehler, Ord andSnyder (2008) Forecasting withexponential smoothing: thestate space approach,Springer-Verlag: time series using RExponential smoothing22 Exponential smoothing methodsSeasonal ComponentTrendNAMC omponent(None)(Additive)(Multiplicative) N(None)N,NN,AN,MA(Additive)A,NA,AA,MAd(A dditive damped)Ad,NAd,AAd,MM(Multiplicative)M,NM ,AM,MMd(Multiplicative damped)Md,NMd,AMd,MForecasting time series using RExponential smoothing22 Exponential smoothing methodsSeasonal ComponentTrendNAMC omponent(None)(Additive)(Multiplicative) N(None)N,NN,AN,MA(Additive)A,NA,AA,MAd(A dditive damped)Ad,NAd,AAd,MM(Multiplicative)M,NM ,AM,MMd(Multiplicative damped)Md,NMd,AMd,M(N,N).