Transcription of NCHS Data Brief - Centers for Disease Control and Prevention
1 NCHS data BriefCynthia L. Ogden, ; Margaret D. Carroll, ; Margaret A. McDowell, , RD; and Katherine M. Flegal, , Division of Health and Nutrition Examination SurveysObesity Among Adults in the United States No Statistically Significant Change Since 2003-2004No. 1 November 2007 HighlightsData from the National Health and Nutrition Examination Survey More than one-third of adults were obese in 2005 2006. This includes of men and of women. Obesity rates have increased since the 1976 1980 survey period. There was no signifi cant change in obesityprevalence, however,between 2003 2004 and 2005 2006 for either menor women. Recent data showracial and ethnic obesitydisparities for women butnot for men. Non-Hispanic black and Mexican-American women weremore likely to be obesethan non-Hispanic white women. Among obese adults, approximately two-thirds have been told by a health care provider that they are continues to be a public health concern in the United States and throughout the world (1 4).
2 In the United States, obesity prevalence doubled among adults between 1980 and 2004 (5,6). Obesity is associated with increased risk of a number of conditions, including diabetes mellitus, cardiovascular Disease , hypertension, and certain cancers, and with increased risk of disability and a modestly elevated risk of all-cause mortality. Although obesity is a consequence of complex factors including an increase in the consumption of calories and a decrease in physical activity, the prevalence of obesity is infl uenced by environmental factors. In the United States, foods are inexpensive and widely available. In addition, food portion sizes have increased and individuals are eating out of the home more often. On the other hand, opportunities for physical activity may have : obesity prevalence trendsFindingsHow many adults in the United States are obese? More than one-third of adults, or over 72 million people, were obese in 2005 1.
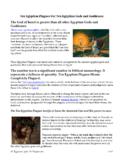
3 Obesity prevalence, by age and sex, and the Healthy People (HP) 2010 obesity target, adults aged 20 years and older: United States, 2005 20060102030405060 andover40 5920 39 TotalHP 2010targetAge in yearsObesity rates have increased dramatically in the last 25 years and among men, there was an increase in obesity prevalence between 1999 and 2006. There was no signifi cant change in obesity prevalence, however, between 2003-2004 and 2005-2006 for men or DEPARTMENT OF HEALTH AND HUMAN SERVICESC enters for Disease Control and PreventionNational center for Health Statistics November 2007No. 1 NCHS data Brief No significant difference in obesity existed between men and women. Adults 40 59 years of age were more likely to be obese compared with younger and older individuals. Approximately 40% of men 40 59 years of age were obese compared with of 20 39 year-olds and of those aged 60 years and older.
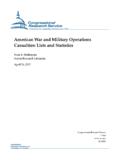
4 Among women, of those 40 59 years of age were obese, whereas of younger women 20 39 years of age were obese. No significant difference existed between the oldest women (60 years and older) and younger women. The Healthy People (HP) 2010 objective of an obesity prevalence less than 15% has not been met for men nor women of any age. The HP 2010 target prevalence for obesity is 15% or about one-half the actual level of obesity. This target level was last achieved in 1980. In 2005 2006, of adults were obese. Has obesity among adults increased since 2004? There was no significant increase in the prevalence of obesity between 2003 2004 and 2005 2006 in the United States. 0 10 20 30 40 2005 20062003 20042001 20021999 2000 Percent Figure 2. Trends in obesity by sex, adults aged 20 years and older: United States, 1999 2000 through 2005 2006. Women Men Among men, the prevalence was in 2003 2004 and in 2005 2006.
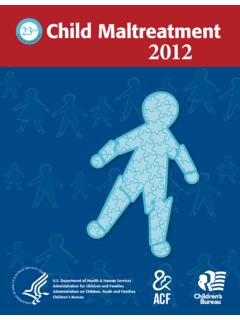
5 There was no statistically significant change. Among women, the prevalence in 2003 2004 was and in 2005 2006 it was Again, these estimates were not statistically different from each November 2007No. 1 NCHS data Brief Changes in the prevalence of obesity do not present a complete picture of the trends in weight (measured by body mass index (BMI)) among adults. A more complete picture can be seen by comparing the distribution of BMI in 1976 1980 with the distribution in 2005 2006 for adults 20 74 years of age. Between 1976 1980 and 2005 2006 the distribution of BMI shifted to the right but the shift was greatest at the upper percentiles of the distribution. This indicates that the entire adult population is heavier, and the heaviest have become much heavier since 1980. NHANES 2005 2006 NHANES 1976 1980 0 5 10 15 20 504540353025201510 Percent Figure 3.
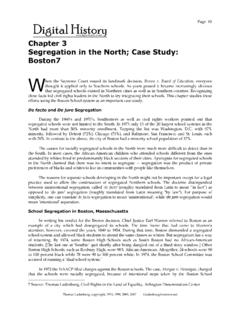
6 Changes in the distribution of body mass index (BMI) between 1976 1980 and 2005 2006, adults aged 20 74 years: United States SOURCE: CDC/NCHS, National Health and Nutrition Examination Survey (NHANES). BMI Are some groups more likely to be obese compared with others? There were large disparities in obesity prevalence by race-ethnic group among women. Non-Hispanic black and Mexican-American women were more likely to be obese than white women. Race/ethnic disparities in obesity were not observed in men. Approximately 53% of non-Hispanic black women and 51% of Mexican-American women 40 59 years of age were obese compared with about 39% of non-Hispanic white women of the same age. 2 November 2007No. 1 NCHS data Brief Among women 60 years and older, 61% of non-Hispanic black women were obese compared with 32% of non-Hispanic white women and 37% of Mexican-American women. Among men, however, the prevalence of obesity did not differ significantly by race/ethnic group.
7 Non-Hispanic black Mexican AmericanNon-Hispanic white Percent Figure 4. Prevalence of obesity, by age, race/ethnicity, and sex, adults aged 20 years and older: United States, 2005 2006 0 10 20 30 40 50 60 70 60 and over 40 5920 3960 and over 40 5920 39 Men Women Age in years (1) (1) (2) Are obese adults told by their health providers that they are overweight? Among obese adults, just over 65% were ever told by a health care provider that they were overweight. Obese women were more likely to be told they were overweight than were men. 3 Percent Figure 5. Obese adults aged 20 years and older ever told they were overweight by a health care provider: United States, 2005 2006 Men Women (1) (1) 0 20 40 60 80 100 Mexican American non-Hispanic black non-Hispanic white Total November 2007No. 1 NCHS data Brief Summary Over 34% of adults aged 20 years and older are obese, but there has been no significant change in the prevalence since 2003 2004.
8 The increasing trend in obesity over the last 25 years is a result of a shift in the entire BMI distribution and an increase in the prevalence of those who are extremely obese. In addition, disparities continue to exist. Non-Hispanic black and Mexican-American women continue to experience a higher prevalence of obesity than their non-Hispanic white counterparts. Although approximately two-thirds of obese individuals have been told by a health care provider that they are overweight, obesity is extremely difficult to treat and the prevalence of obesity is not declining. Nonetheless, even without reaching ideal weight, research has shown that a moderate amount of weight loss can be beneficial in terms of reducing risk factors, such as high blood pressure. Maintenance of weight loss, however, remains difficult (7). Definitions Body mass index (BMI) is calculated as weight in kilograms divided by height in meters squared, rounded to one decimal place.
9 For adults 20 years or older, obesity is defined as a BMI of or higher (8). See the table below for examples of obesity at different heights. The Healthy People 2010 target is 15% obesity. Height Weight Range 5 0 153 lbs or more 5 6 186 lbs or more 5 9 203 lbs or more data source The National Health and Nutrition Examination Survey (NHANES) data were used for these analyses (9). NHANES is designed to monitor the health and nutritional status of the United States civilian, noninstitutionalized population. The survey consists of interviews conducted in participants homes, standardized physical examinations conducted in mobile examination Centers , and laboratory tests utilizing blood and urine specimens provided by participants during the physical examination. The NHANES sample is selected through a complex, multistage design that includes selection of primary sampling units (counties), household segments within the counties, and finally sample persons from selected households.
10 The sample design includes oversampling in order to obtain reliable estimates of health and nutritional measures for population subgroups. In 2005 2006, African Americans, Mexican Americans, persons with low income, adolescents 12 19 years of age, and adults 60 years and older were oversampled. In 1999, NHANES became a continuous survey, 4 November 2007No. 1 NCHS data Brief fielded on an ongoing basis. Each year of data collection is based on a representative sample covering all ages of the civilian, noninstitutionalized population. Public-use data files are released in 2-year cycles. Sample weights, which account for the differential probabilities of selection, nonresponse and noncoverage, are incorporated into the estimation process. The race/ethnic estimates were age adjusted to the 2000 standard population using three age groups, 20 39, 40 59, and 60 years and older, in order to compare prevalence estimates between race/ethnic population subgroups that differ with respect to their age distributions.