Transcription of Tutorial 7 - Sampling
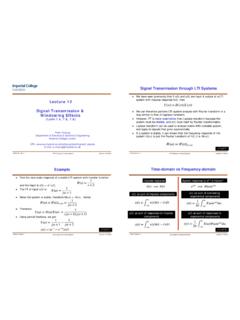
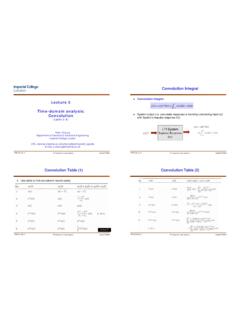
1 Signals & Linear Systems Tutorial Sheet 7 sampling (Lectures 12 - 13). 1.* By applying the parseval 's theorem , show that .. sinc2 (kx)dx = . k 2.* Fig. Q2 (a) and (b) shows Fourier spectra of signals f1 (t ) and f 2 (t ) . Determine the Nyquist Sampling rates for the following signals. (Hint: Use the frequency convolution and the width property of the convolution.). a) f1 (t ) b) f 2 (t ) c) f12 (t ). d) f 23 (t ) e) f1 (t ) f 2 (t ). (a) (b). Figure Q2. 3.* Signals f1 (t ) = 104 rect (104 t ) and f 2 (t ) = (t ) are applied at the inputs of ideal lowpass filters . H1 ( ) = rect ( ) and H 2 ( ) = rect ( ) . The outputs y1 (t ) and y2 (t ) of these filters are multiplied 40, 000 20, 000 . to obtain the signal y (t ) = y1 (t ) y2 (t ) as shown in Figure Q3.
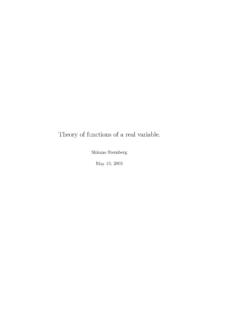
2 A) Sketch F1 ( ) and F2 ( ) . b) Sketch H1 ( ) and H 2 ( ) . c) Sketch Y1 ( ) and Y2 ( ) . d) Find the Nyquist Sampling rate of y1 (t ) , y2 (t ) and y (t ) . Figure Q3. PYKC 11 Feb 08 2. 4.** For the signal e at u (t ) , determine the bandwidth of an anti-aliasing filter if the essential bandwidth of the signal contains 99% of the signal energy. 5.** A zero-order hold circuit shown in Fig. Q5 is often used to reconstruct a signal f(t) from its samples. a) Find the unit impulse response of this circuit. b) Find the transfer function H ( ) , and sketch H ( ) . c) Sketch the output of this circuit for an input f(t) which is cycle of a sinewave. Figure Q5. PYKC 11 Feb 08 3.