Transcription of -- 1/x weighting 2 Grand Mean 2 Sum absolute …
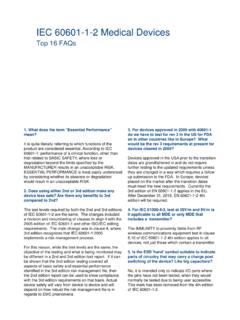
1 -- Comparison of 1/x 2 vs 1/x weighting for Standard Curves of pharmaceutical PK/TK Data Dale Schoener, Khanh Nguyen, Michael Buonarati Alta Analytical Laboratory, El Dorado Hills, CA. Introduction Results and Discussion High Variance Summary According to pharmaceutical industry guidance set by the FDA1. and Best Practice guidance In a typical calibration curve the variance (SD squared) increases as the concentration increases. See Figure 1. documents2, calibration curves should use the simplest model that adequately describes the 1/x2 weighting LLOQ MID QC HIGH QC which is actual data showing how variance changes exponentially over a 1000 fold range.
2 A 1000 fold standard QC curve range can have over a 150,000 fold change in variance between the low and high standard and this is the concentration-response relationship. Similarly the EMEA states a relationship which can simply Grand Mean and adequately describe the response of the instrument with regard to the analyte should be accuracy reason a non-weighted curve does not work. A non-weighted regression is drawn to minimize the sum of the Min accuracy applied3. Max accuracy squared vertical distances of all the standard points from the regression line. This favors the higher variance of the higher standards leading to good accuracy for the highest standards but very poor accuracy for the lowest Sum absolute Total absolute error over all three standards.
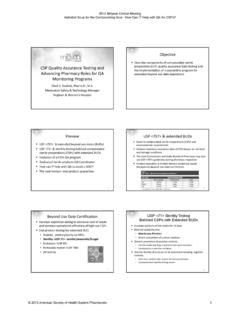
3 A non-weighted linear regression does not work because this model assumes equal variance error QC levels: Number of standard curve points dropped over 30 runs (480 standard curve points total): 30. over the entire range of samples. In a typical calibration curve the variance (SD squared) Figure 2 shows the sum of the error for the standard curve points for a 1/x2 and 1/x weighted linear regression. increases as the concentration increases. 1/x weighting LLOQ MID QC HIGH QC Note that the sum of the % difference from the expected is 0 for the 1/x2 curve. QC. Grand Mean The solution to improve the accuracy for the lowest standards is of course to use weighting .
4 A accuracy Table 1 displays the mean accuracy and range for the low variance ( CV for non-LLOQ standards, Min accuracy linear regression with 1/x2 weighting is the most common regression and weighting used. The Max accuracy CV at the LLOQ) scenario over 30 simulated runs. Both weightings show good accuracy and a narrow accuracy reason the 1/x2 weighting works so well is that it draws a regression line that minimizes the sum Sum absolute Total absolute error over all three QC. range at all three QC levels. of the vertical deviation of the standard points from the regression line on a percentage basis. If error levels: Number of standard curve points dropped over 30 runs (480 standard curve points total): 28.
5 The % difference from the expected results off the standard curve is summed for all the data Table 2 displays the mean accuracy and range for a high variance scenario (8% CV for non-LLOQ standards, points, this sum will be zero for a 1/x2 weighted linear regression. Given that acceptance criteria 15% CV at the LLOQ) over 30 simulated runs. The Grand mean accuracies are essentially the same for both in this industry for standards and QCs is a constant percentage over nearly all the concentration Table 2: n=30 runs, n= 6 replicates per QC level 1000 fold range, high QC is at ULOQ, mid QC of weightings and the accuracy spread is the same at the mid and high QC levels.
6 For both weightings 1 standard the ULOQ , 8 standard curve levels, each level in duplicate. range, then a 1/x2 weighting , which minimizes the sum of the deviation of the standard curve Figure 1. The change in variance vs. concentration over a 1000 fold curve point was eliminated per run on average. The LLOQ accuracy range is 88% to 115% for the 1/x2 weighting CV for standards and QCs: 8% CV for non-LLOQ standards and QCs, 15% CV at the LLOQ. standard curve range. and 77% to 121% for the 1/x weighting . For the 1/x weighting the mean of two of the 30 LLOQ sets are outside points on a percentage basis, would be the most logical weighting to use.
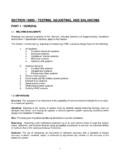
7 Still people will look at a 1/x weighting in the belief that if this works, and given that it is simpler since there is no Non Linearity and Low Variance Summary the 20% range. In this high variance situation the 1/x2 weighting provides better results at the LLOQ. The total squared term, then it should be used. absolute error over all three QC levels is lower for the 1/x2 weighting . 1/x2 weighting LLOQ MID QC HIGH QC. QC Table 3 displays the mean accuracy and range for the low variance scenario but with non-linearity over 30. The choice of weighting is typically taught as taking the sum of the absolute value of the relative 2.
8 1/x weighting 1/x weighting Grand Mean simulated runs. The accuracy at the mid and high QC levels are 100,100 % for 1/x and 93, 94% for 1/x2. error of several QC data points at each of several concentrations over the entire concentration % absolute % % absolute % accuracy range. This summation is done for the various weighting factors4-6. The least amount of %. difference difference from from %. difference difference from from Min accuracy weighting . The accuracy at the LLOQ level averages 104%, range 99% to 108%, for the 1/x2 weighting and Max accuracy weighting that minimizes this error is chosen. This method will provide for the best x PAR concentration accuracy expected expected concentration accuracy expected expected averages 93%, range 83% to 98% for the 1/x weighing.
9 No standard curve points were rejected for the 1/x2. 1 regression/ weighting for the 3-4 validation runs. This same regression/ weighting will then have 1 Sum absolute Total absolute error over all three weighting and 12 points (average per run) were rejected for the 1/x weighting . Here the 1/x weighting 2 error QC levels: provides for better accuracy in the upper end of the curve, but lower accuracy with a broader accuracy range at to be used for all subsequent sample analysis runs where over time factors typical for LC/MS 2 Number of standard curve points dropped over 30 runs (480 standard curve points total): 0. runs such as higher than expected variance or non-linearity are experienced.
10 Therefore the 4. 4. the LLOQ. weighting decision needs be based on more than the validation results only and typically the 20 1/x weighting LLOQ MID QC HIGH QC. 20 most rugged weighting needs to be chosen. 100 QC Table 4 displays the mean accuracy and range for high variance and non-linearity conditions over 30 simulated Grand Mean The purpose of this study is to compare 1/x weighting and 1/ x2 weighting using simulated peak 100. 400. accuracy runs. For the 1/x2 weighting the mid and high QCs all pass with mean accuracies of 95% and 95%, with ranges area ratios to determine which weighting is the most rugged. Low variance data along with real 400 Min accuracy of 87% to 101% and 86% to 102 % for the mid and high QC levels respectively.