Transcription of © 2010 Oracle Corporation 1
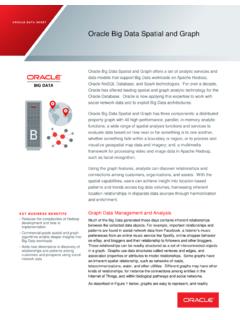
1 1 2010 Oracle Corporation <Insert Picture Here>Introduction to Geospatial Visualization inOracle business intelligence EnterpriseEdition, 11gProduct Mgmt., Oracle business intelligence andSpatial3 2010 Oracle Corporation <Insert Picture Here>AgendaIntroductionWhen are Map views usefulOracle business intelligence 11gGeospatial VisualizationsFurther Examples4 2010 Oracle CorporationIntroductionEffective interactive visualization and analysis are key to insightThe Oracle BI Suite offers numerous choices ..5 2010 Oracle CorporationBI and Maps: A Natural FitMaps are a natural choice for representing spatially-related dataHelp understand many phenomena and their relationshipsMap courtesy StrangeMaps, Wikipedia (John Snow)Cholera incidents and possibly contaminated wellMore bars (red) or grocery stores (brown) per 10,000 people6 2010 Oracle CorporationSpatial is a Natural BI Component IDC recognized BI 2010 Oracle CorporationSpatial IntelligenceNew Depth and Breadth of AnalysisIn effect, Oracle is "flipping the switch" and turning spatial into a product feature when such a capability is needed.
2 It will be daunting to compete against this , we haven't heard much about geospatial and SQL Server integration you are in danger of becoming a non-player. And IBM continues to play with ESRI only, and resists striking out on its own in what could be a missed opportunity. Most BI data alreadycontains geographic dimension of analysis Deliver deeper analytical insightsthrough Spatial visualisation and data IncreasetheROI ofBI & GIS systems 9 2010 Oracle CorporationSpatial Analytics Give a Real World PerspectiveMost business data has a locationSELECT , competitor c,bank bWHERE 1604 ANDSDO_WITHIN_DISTANCE( , , distance=2 unit=mile') = 'TRUE Find all competitorswithin 2 milesof Northport Branch10 2010 Oracle CorporationMap driven filters, or prompts, in BI dashboardsOnly Possible With Spatial AnalyticsShow incidents within 750 ft of selected park11 2010 Oracle CorporationWhen are Map views usefulVisualizing data related to geographic or detecting spatial relationships and lots of data in a relatively small down from a (map)
3 Overview to a detailed report, chart, or 2010 Oracle CorporationWhy Spatial Map Visualizations?The Original High-Density Visualization13 2010 Oracle CorporationWhy Spatial Map Visualizations?Custom Territories 2010 , NAVTEQ14 2010 Oracle CorporationWhy Spatial Map Visualizations?Ideal For Master-Detail Analysis 2010 , NAVTEQ15 2010 Oracle Corporation <Insert Picture Here> Oracle business intelligence enterprise Edition 11g16 2010 Oracle CorporationOracle business IntelligenceComplete, Open, IntegratedInteractive DashboardsReporting &PublishingAd-hoc AnalysisDetect& AlertOffice IntegrationSearchEmbeddedDataIntegration Mobile ScorecardsCollaborateOLTP & ODSS ystemsData WarehouseData MartPackagedApplications( Oracle , SAP, Others)ExcelXML/OfficeBusinessProcessOLA PS ourcesExadataUnstructured & Semi-StructuredCommon enterprise Information ModelCommon Metadata Foundation across all Data SourcesCommon Security, Access Control, Authorization, AuditingCommon Request Generation and Optimized Data Access ServicesCommon Clustering, Workload Management, & DeploymentCommon Systems & Operational Lifecycle Management17 2010 Oracle CorporationPart of Oracle Fusion MiddlewareInfrastructure & ManagementDatabaseMiddlewareApplications 18 2010 Oracle CorporationOracle BI 11gNew Interactive VisualizationsGain Insight Quicker with Greater VisibilityRich interactive visualizationsAnimated transitionsRange slidersPaging slidersMaster-Detail linkingExtensive and extended set of chart typesConsistent.
4 Hi-fidelity charting across Oracle product line19 2010 Oracle CorporationInteractiveDashboardsGeospati al VisualizationOffice IntegrationMobileReportsUnified End User ExperienceComplete. Consistent. & PortalsSearchAd-hocQueriesCollaborationS corecards20 2010 Oracle CorporationSpatial Visualization in Oracle BI 11gGain new understanding of customers and marketsSpatial Integration and Mapping Interactive Map Controls Global digital Map data provided by NAVTEQ Extensive Mapping Visualizations Seamless Dashboard integration Built with enterprise Semantic model21 2010 Oracle CorporationKnown as Map Views in Oracle BIEE 11g 22 2010 Oracle CorporationSpatial Visualization: Map views in OBIEE 11g23 2010 Oracle CorporationFor Example: business DataYearPlant Location CountryPlant Location StateSpending TypeSpendSuppliersBuyersInvoiced Quantity24 2010 Oracle Corporation 2010 , NAVTEQI nvoiced QuantityYearSpendCountryBuyersYearBuyers , SuppliersYearBuyers, SuppliersSpending TypeAnd Resulting Analysis 25 2010 Oracle CorporationOracle BI enterprise Edition & Location IntegrationMap views.
5 Thematic Map-based VisualizationsThematic Mapping in OBIEE 11gFirst-class view in AnswersPoint-and-click interfaceCreation of Map ViewsInteractions are UI-drivenState managementDashboard PromptsPrint & ExportAgentsIntegration with Presentation Server stackOracle Fusion Middleware MapViewer26 2010 Oracle CorporationSupport for thematic overlaysMaster-detail linkingMap Metadata ManagementVia Presentation Server AdministrationOracle BI enterprise Edition & Location IntegrationMap views: Thematic Map-based Visualizations27 2010 Oracle Corporation <Insert Picture Here>More examples28 2010 Oracle CorporationPerformance metrics on map, chart, and table views29 2010 Oracle Corporation30 2010 Oracle CorporationDrilling and multiple measures on a map31 2010 Oracle CorporationA dashboard page can have multiple map views32 2010 Oracle CorporationThe background map itself can be a thematic map33 2010 Oracle CorporationSummary: OBIEE 11g Map view feature New view type in 11g Supports common use cases And interactions: drilling, master-detail linking34 2010 Oracle 2010 Oracle Corporation36 2010 Oracle Corporatio