Transcription of 2.2.24. Absorption spectrophotometry, infrared - uspbpep.com
1 EUROPEAN PHARMACOPOEIA Absorption spectrophotometry , infrared sensitivity to obtain a maximum absorbance reading. Rinse the residuals of each calibration level are randomly in order to avoid contamination and memory effects. After distributed around the calibration curve. completing the analysis, rinse with water R or acidified water. Calculate the mean and relative standard deviation for the If a solid sampling technique is applied, full details of the lowest and highest calibration level. procedure are provided in the monograph. When the ratio of the estimated standard deviation of the Ensure that the concentrations to be determined fall lowest and the highest calibration level is less than or preferably within the linear part of the calibration curve. If greater than , a more precise estimation of the calibration this is not possible, the calibration plots may also be curved curve may be obtained using weighted linear regression.
2 And are then to be applied with appropriate calibration Both linear and quadratic weighting functions are applied software. to the data to find the most appropriate weighting function Determinations are made by comparison with reference to be employed. If the means compared to the calibration solutions with known concentrations of the element to curve show a deviation from linearity, two-dimensional linear be determined either by the method of direct calibration regression is used. (Method I) or the method of standard additions (Method II). ACCURACY. METHOD I - DIRECT CALIBRATION Verify the accuracy preferably by using a certified reference For routine measurements 3 reference solutions and a blank material (CRM). Where this is not possible, perform a test solution are prepared and examined. for recovery. Prepare the solution of the substance to be examined (test Recovery. For assay determinations a recovery of 90 per cent solution) as prescribed in the monograph.
3 Prepare not fewer to 110 per cent is to be obtained. For other determinations, than 3 reference solutions of the element to be determined, for example, for trace element determination the test is the concentrations of which span the expected value in not valid if recovery is outside of the range 80 per cent the test solution. For assay purposes, optimal calibration to 120 per cent at the theoretical value. Recovery may be levels are between and times the expected content determined on a suitable reference solution (matrix solution). of the element to be determined or the limit prescribed in which is spiked with a known quantity of analyte (middle the monograph. For purity determination, calibration levels concentration of the calibration range). are the limit of detection and times the limit specified REPEATABILITY. for the element to be determined. Any reagents used in the The repeatability is not greater than 3 per cent for an assay preparation of the test solution are added to the reference and not greater than 5 per cent for an impurity test.
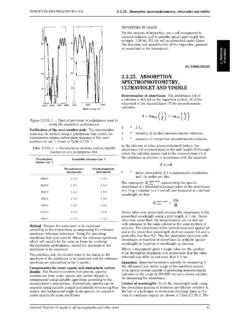
4 And blank solutions at the same concentration. Introduce each of the solutions into the instrument using LIMIT OF QUANTIFICATION. the same number of replicates for each of the solutions to Verify that the limit of quantification (for example, obtain a steady reading. determined using the 10 approach) is below the value to be measured. Calculation. Prepare a calibration curve from the mean of the readings obtained with the reference solutions by plotting the means as a function of concentration. Determine 01/2008:20224. the concentration of the element in the test solution from the curve obtained. Absorption . METHOD II - STANDARD ADDITIONS spectrophotometry , infrared . Add to at least 3 similar volumetric flasks equal volumes of the solution of the substance to be examined (test infrared spectrophotometers are used for recording spectra solution) prepared as prescribed. Add to all but 1 of the in the region of 4000-650 cm 1 ( m) or in some flasks progressively larger volumes of a reference solution cases down to 200 cm 1 (50 m).
5 Containing a known concentration of the element to be APPARATUS. determined to produce a series of solutions containing Spectrophotometers for recording spectra consist of a steadily increasing concentrations of that element known suitable light source, monochromator or interferometer and to give responses in the linear part of the curve, if possible. detector. Dilute the contents of each flask to volume with solvent. Introduce each of the solutions into the instrument, using Fourier transform spectrophotometers use polychromatic the same number of replicates for each of the solutions, to radiation and calculate the spectrum in the frequency obtain a steady reading. domain from the original data by Fourier transformation. Spectrophotometers fitted with an optical system capable of Calculation. Calculate the linear equation of the graph using producing monochromatic radiation in the measurement a least-squares fit and derive from it the concentration of the region may also be used.
6 Normally the spectrum is given as element to be determined in the test solution. a function of transmittance, the quotient of the intensity of the transmitted radiation and the incident radiation. It may VALIDATION OF THE METHOD. also be given in absorbance. Satisfactory performance of methods prescribed in monographs is verified at suitable time intervals. The absorbance (A) is defined as the logarithm to base 10 of the reciprocal of the transmittance (T) : LINEARITY. Prepare and analyse not fewer than 4 reference solutions over the calibration range and a blank solution. Perform not fewer than 5 replicates. The calibration curve is calculated by least-square regression from all measured data. The regression curve, the means, the T = , measured data and the confidence interval of the calibration I intensity of incident radiation, 0 =. curve are plotted. The operating method is valid when : the correlation coefficient is at least , I = intensity of transmitted radiation.
7 General Notices (1) apply to all monographs and other texts 39. Absorption spectrophotometry , infrared EUROPEAN PHARMACOPOEIA PREPARATION OF THE SAMPLE FOR RECORDING BY DIFFUSE REFLECTANCE. FOR RECORDING BY TRANSMISSION OR Absorption Solids. Triturate a mixture of the substance to be examined Prepare the substance by one of the following methods. with finely powdered and dried potassium bromide R. or potassium chloride R. Use a mixture containing Liquids. Examine a liquid either in the form of a film between approximately 5 per cent of the substance, unless otherwise 2 plates transparent to infrared radiation, or in a cell of specified. Grind the mixture, place it in a sample cup and suitable path length, also transparent to infrared radiation. examine the reflectance spectrum. Liquids or solids in solution. Prepare a solution in a suitable The spectrum of the sample in absorbance mode may be solvent. Choose a concentration and a path length of the obtained after mathematical treatment of the spectra by the cell which give a satisfactory spectrum.
8 Generally, good Kubelka-Munk function. results are obtained with concentrations of 10-100 g/l for a path length of mm. Absorption due to the solvent FOR RECORDING BY ATTENUATED TOTAL REFLECTION. is compensated by placing in the reference beam a similar Attenuated total reflection (including multiple reflection). cell containing the solvent used. If an FT-IR instrument involves light being reflected internally by a transmitting is used, the Absorption is compensated by recording the medium, typically for a number of reflections. However, spectra for the solvent and the sample successively. The several accessories exist where only one reflection occurs. solvent absorbance, corrected by a compensation factor, is Prepare the substance as follows. Place the substance to be subtracted using calculation software. examined in close contact with an internal reflection element Solids. Examine solids dispersed in a suitable liquid (mull) (IRE) such as diamond, germanium, zinc selenide, thallium or in a solid (halide disc), as appropriate.
9 If prescribed in the bromide-thallium iodide (KRS-5) or another suitable material monograph, make a film of a molten mass between 2 plates of high refractive index. Ensure close and uniform contact transparent to infrared radiation. between the substance and the whole crystal surface of the internal reflection element, either by applying pressure or by dissolving the substance in an appropriate solvent, then A. Mull covering the IRE with the obtained solution and evaporating to dryness. Examine the attenuated total reflectance (ATR). Triturate a small quantity of the substance to be examined spectrum. with the minimum quantity of liquid paraffin R or other suitable liquid ; 5-10 mg of the substance to be examined is usually sufficient to make an adequate mull using one IDENTIFICATION USING REFERENCE SUBSTANCES. drop of liquid paraffin R. Compress the mull between Prepare the substance to be examined and the reference 2 plates transparent to infrared radiation.
10 Substance by the same procedure and record the spectra between 4000-650 cm 1 ( m) under the same B. Disc operational conditions. The transmission minima ( Absorption maxima) in the spectrum obtained with the substance to be Triturate 1-2 mg of the substance to be examined examined correspond in position and relative size to those in with 300-400 mg, unless otherwise specified, of finely the spectrum obtained with the reference substance (CRS). powdered and dried potassium bromide R or potassium chloride R. These quantities are usually sufficient to When the spectra recorded in the solid state show differences give a disc of 10-15 mm diameter and a spectrum of in the positions of the transmission minima ( Absorption suitable intensity. If the substance is a hydrochloride, it maxima), treat the substance to be examined and the is recommended to use potassium chloride R. Carefully reference substance in the same manner so that they grind the mixture, spread it uniformly in a suitable crystallise or are produced in the same form, or proceed as die, and submit it to a pressure of about 800 MPa prescribed in the monograph, then record the spectra.