Example: biology
2 Related Work
diagnose anomalies by identifying deviations from these re-lationships. Graph-based methods provide a way to model the re-lationships between sensors by representing the inter-dependencies with edges. Such methods include probabilis-tic graphical models, which encode joint probability distri-butions, as described in (Bach and Jordan 2004; Tank ...
Tags:
Information
Domain:
Source:
Link to this page:
Documents from same domain
![arXiv:0706.3639v1 [cs.AI] 25 Jun 2007](/cache/preview/4/1/3/9/3/1/4/b/thumb-4139314b93ef86b7b4c2d05ebcc88e46.jpg)
arXiv:0706.3639v1 [cs.AI] 25 Jun 2007
arxiv.orgarXiv:0706.3639v1 [cs.AI] 25 Jun 2007 Technical Report IDSIA-07-07 A Collection of Definitions of Intelligence Shane Legg IDSIA, Galleria …
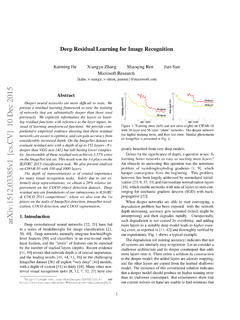
Deep Residual Learning for Image Recognition - …
arxiv.orgDeep Residual Learning for Image Recognition Kaiming He Xiangyu Zhang Shaoqing Ren Jian Sun Microsoft Research fkahe, v-xiangz, v-shren, jiansung@microsoft.com
![arXiv:1301.3781v3 [cs.CL] 7 Sep 2013](/cache/preview/4/d/5/0/4/3/4/0/thumb-4d504340120163c0bdf3f4678d8d217f.jpg)
arXiv:1301.3781v3 [cs.CL] 7 Sep 2013
arxiv.orgFor all the following models, the training complexity is proportional to O = E T Q; (1) where E is number of the training epochs, T is the number of …
![@google.com arXiv:1609.03499v2 [cs.SD] 19 Sep 2016](/cache/preview/c/3/4/9/4/6/9/b/thumb-c349469b499107d21e221f2ac908f8b2.jpg)
@google.com arXiv:1609.03499v2 [cs.SD] 19 Sep 2016
arxiv.orgwhere 1 <x t <1 and = 255. This non-linear quantization produces a significantly better reconstruction than a simple linear quantization scheme. …
A Tutorial on UAVs for Wireless Networks: …
arxiv.orgA Tutorial on UAVs for Wireless Networks: Applications, Challenges, and Open Problems Mohammad Mozaffari 1, ... to UAVs in wireless communications is the work in …
Adversarial Generative Nets: Neural Network …
arxiv.orgAdversarial Generative Nets: Neural Network Attacks on State-of-the-Art Face Recognition Mahmood Sharif, Sruti Bhagavatula, Lujo Bauer Carnegie Mellon University
Massive Exploration of Neural Machine Translation ...
arxiv.orgMassive Exploration of Neural Machine Translation Architectures Denny Britzy, Anna Goldie, Minh-Thang Luong, Quoc Le fdennybritz,agoldie,thangluong,qvlg@google.com Google Brain
Mastering Chess and Shogi by Self-Play with a …
arxiv.orgMastering Chess and Shogi by Self-Play with a General Reinforcement Learning Algorithm David Silver, 1Thomas Hubert, Julian Schrittwieser, Ioannis Antonoglou, 1Matthew Lai, Arthur Guez, Marc Lanctot,1
Going deeper with convolutions - arXiv
arxiv.orgGoing deeper with convolutions Christian Szegedy Google Inc. Wei Liu University of North Carolina, Chapel Hill Yangqing Jia Google Inc. Pierre Sermanet
Andrew G. Howard Menglong Zhu Bo Chen Dmitry ...
arxiv.orgMobileNets: Efficient Convolutional Neural Networks for Mobile Vision Applications Andrew G. Howard Menglong Zhu Bo Chen Dmitry Kalenichenko Weijun Wang Tobias Weyand Marco Andreetto Hartwig Adam
Related documents

Research, Research Gap and the Research Problem
mpra.ub.uni-muenchen.dere lationships are ac tually the orist’s gue sse s about the re ality. Suc h gue sse s are c alle d as ‘Re se arc h Hypothe sis’ or ‘Propositions’. Finally, the re se arc he r may te st the re se arc h hypothe sis and c onc lude the validity of the the ory. Thus, this is an e …

Multi-Modality Cross Attention Network for Image and ...
openaccess.thecvf.comHowever, they mainly explore the intra-modality re-lationships. Different from existing methods, the proposed cross-attention model can discover both the intra-modality and inter-modality relationships jointly for image and sen-tence matching in a unified model. 3. Multi-Modality Cross Attention Network

Analytical Procedures - AICPA
us.aicpa.orgconsist of evaluations of financial information made by a study of plausible re-lationships among both financial and nonfinancial data. Analytical procedures range from simple comparisons to the use of complex models involving many relationships and elements of data. A basic premise underlying the application

THE RETAIL DISTRIBUTION CHANNEL
mrpronan.weebly.comgoods in anticipation of seasonal sales peaks. Depending on how close their re-lationships, channel members may also work together to purchase goods or services in greater quantity at discounts, passing the savings on to customers. Even for consumers, the distribution chain is handy—beyond handy, in fact! It has become a necessity in our society.
Friendship Quality and Social Development
www1.psych.purdue.eduinfluence the more positive the re-lationships with those friends are. That is, having high-quality friend-ships with delinquent friends is as-sumed to increase the influence of those friends, thereby increasing the degree to which adolescents be-come like their friends over time. Many other theories include the hypothesis that friends’ influence

Cracks and Crack Control in Concrete Structures
www.pci.organalysis furnished the following re-lationships for the mean direct tensile strength, f tm , related to the 28-day compressive cylinder strength f,' of con-crete: fcm = 2.1 (fc)z/3 (psi) fi m = 0.34 (ff)2"(N/mm2) The statistical analysis indicated that the coefficient in this equation can be modified to 1.4 (0.22) and 2.7 (0.45) to