Example: dental hygienist

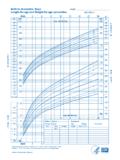
2 to 20 years: Girls, Stature-for-age and Weight-for-age ...

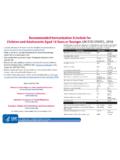
2 to 20 years: Girls NAME. Stature-for-age and Weight-for-age percentiles RECORD #. 12 13 14 15 16 17 18 19 20. Mother's Stature Father's Stature cm in Date Age weight Stature BMI*. AGE (YEARS) 76. 190. 74. 185 S. 72. 180 T. 70 A. 97 175 T. 90. 68 U. 170 R. 75 66. 165 E. in cm 3 4 5 6 7 8 9 10 11 50. 64. 160 25 160. 62 62. 155 10 155. S 60 60. T 3. 150 150. A 58. T 145. U 56. 140 105 230. R. 54. E 135 100 220. 52. 130 95 210. 50. 125 97 90 200. 48 190. 120 85. 46 180. 115 80. 44 170. 110 90 75. 42 160. 105 70. 150 W. 40 75. 100 65 140 E. 38 I. 95 60 130 G. 50. 36 90 H. 55 120. 25 T. 34 85 50 110. 10. 32 80 3 45 100. 30. 40 90. 80 35 35 80. W 70 70. 30 30. E 60 60. I 25 25. G 50 50. H 20 20. 40 40. T. 15 15. 30 30. 10 10. lb kg AGE (YEARS) kg lb 2 3 4 5 6 7 8 9 10 11 12 13 14 15 16 17 18 19 20.

Stature Weight-for-age percentiles-for-age and NAME RECORD # W E I G H T W E I G H T S T A T U R E S T A T U R E kg 10 15 20 25 30 35 80 85 90 95 100 105 110 115 120 125 130 135 140 145 150 155 cm 150 155 160 165 170 175 180 185 190 kg 10 15 20 25 30 35 105 45 50 55 60 65 70 75 80 85 90 95 100 ... 2 to 20 years: Girls, Stature-for-age and ...

Tags:

  Weight, For age, For age percentiles, Percentiles, W e i g h t w e i g h t, For age and weight

Information

Domain:

Source:

Link to this page:

Please notify us if you found a problem with this document:

Other abuse

Transcription of 2 to 20 years: Girls, Stature-for-age and Weight-for-age ...

1 2 to 20 years: Girls NAME. Stature-for-age and Weight-for-age percentiles RECORD #. 12 13 14 15 16 17 18 19 20. Mother's Stature Father's Stature cm in Date Age weight Stature BMI*. AGE (YEARS) 76. 190. 74. 185 S. 72. 180 T. 70 A. 97 175 T. 90. 68 U. 170 R. 75 66. 165 E. in cm 3 4 5 6 7 8 9 10 11 50. 64. 160 25 160. 62 62. 155 10 155. S 60 60. T 3. 150 150. A 58. T 145. U 56. 140 105 230. R. 54. E 135 100 220. 52. 130 95 210. 50. 125 97 90 200. 48 190. 120 85. 46 180. 115 80. 44 170. 110 90 75. 42 160. 105 70. 150 W. 40 75. 100 65 140 E. 38 I. 95 60 130 G. 50. 36 90 H. 55 120. 25 T. 34 85 50 110. 10. 32 80 3 45 100. 30. 40 90. 80 35 35 80. W 70 70. 30 30. E 60 60. I 25 25. G 50 50. H 20 20. 40 40. T. 15 15. 30 30. 10 10. lb kg AGE (YEARS) kg lb 2 3 4 5 6 7 8 9 10 11 12 13 14 15 16 17 18 19 20.

2 Published May 30, 2000 (modified 11/21/00). SOURCE: Developed by the National Center for Health Statistics in collaboration with the National Center for Chronic Disease Prevention and Health Promotion (2000).


Related search queries