Transcription of 20 STATISTICAL LEARNING METHODS
1 20 STATISTICAL LEARNING . METHODS . In which we view LEARNING as a form of uncertain reasoning from observations. Part V pointed out the prevalence of uncertainty in real environments. Agents can handle uncertainty by using the METHODS of probability and decision theory, but first they must learn their probabilistic theories of the world from experience. This chapter explains how they can do that. We will see how to formulate the LEARNING task itself as a process of probabilistic inference (Section ). We will see that a Bayesian view of LEARNING is extremely powerful, providing general solutions to the problems of noise, overfitting, and optimal prediction.
2 It also takes into account the fact that a less-than-omniscient agent can never be certain about which theory of the world is correct, yet must still make decisions by using some theory of the world. We describe METHODS for LEARNING probability models primarily Bayesian networks . in Sections and Section looks at LEARNING METHODS that store and recall specific instances. Section covers neural network LEARNING and Section introduces kernel machines. Some of the material in this chapter is fairly mathematical (requiring a basic un- derstanding of multivariate calculus), although the general lessons can be understood without plunging into the details.
3 It may benefit the reader at this point to review the material in Chapters 13 and 14 and to peek at the mathematical background in Appendix A. S TATISTICAL L EARNING. The key concepts in this chapter, just as in Chapter 18, are data and hypotheses. Here, the data are evidence that is, instantiations of some or all of the random variables describing the domain. The hypotheses are probabilistic theories of how the domain works, including logical theories as a special case. Let us consider a very simple example. Our favorite Surprise candy comes in two flavors: cherry (yum) and lime (ugh).
4 The candy manufacturer has a peculiar sense of humor and wraps each piece of candy in the same opaque wrapper, regardless of flavor. The candy is sold in very large bags, of which there are known to be five kinds again, indistinguishable from the outside: 712. Section STATISTICAL LEARNING 713. h1 : 100% cherry h2 : 75% cherry + 25% lime h3 : 50% cherry + 50% lime h4 : 25% cherry + 75% lime h5 : 100% lime Given a new bag of candy, the random variable H (for hypothesis) denotes the type of the bag, with possible values h1 through h5 . H is not directly observable, of course. As the pieces of candy are opened and inspected, data are revealed D1 , D2.
5 , DN , where each Di is a random variable with possible values cherry and lime. The basic task faced by the agent is to predict the flavor of the next piece of Despite its apparent triviality, this scenario serves to introduce many of the major issues. The agent really does need to infer a theory of its world, albeit a very simple one. BAYESIAN LEARNING Bayesian LEARNING simply calculates the probability of each hypothesis, given the data, and makes predictions on that basis. That is, the predictions are made by using all the hy- potheses, weighted by their probabilities, rather than by using just a single best hypothesis.
6 In this way, LEARNING is reduced to probabilistic inference. Let D represent all the data, with observed value d; then the probability of each hypothesis is obtained by Bayes' rule: P (hi |d) = P (d|hi )P (hi ) . ( ). Now, suppose we want to make a prediction about an unknown quantity X. Then we have X X. P(X|d) = P(X|d, hi )P(hi |d) = P(X|hi )P (hi |d) , ( ). i i where we have assumed that each hypothesis determines a probability distribution over X. This equation shows that predictions are weighted averages over the predictions of the indi- vidual hypotheses. The hypotheses themselves are essentially intermediaries between the raw data and the predictions.
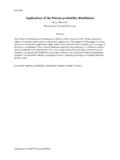
7 The key quantities in the Bayesian approach are the hypothesis HYPOTHESIS PRIOR prior, P (hi ), and the likelihood of the data under each hypothesis, P (d|hi ). LIKELIHOOD For our candy example, we will assume for the time being that the prior distribution over h1 , .. , h5 is given by , , , , , as advertised by the manufacturer. The likelihood of the data is calculated under the assumption that the observations are that is, independently and identically distributed so that Y. P (d|hi ) = P (dj |hi ) . ( ). j For example, suppose the bag is really an all-lime bag (h5 ) and the first 10 candies are all lime; then P (d|h3 ) is , because half the candies in an h3 bag are Figure (a).
8 Shows how the posterior probabilities of the five hypotheses change as the sequence of 10. lime candies is observed. Notice that the probabilities start out at their prior values, so h 3. is initially the most likely choice and remains so after 1 lime candy is unwrapped. after 2. 1 Statistically sophisticated readers will recognize this scenario as a variant of the urn-and-ball setup. We find urns and balls less compelling than candy; furthermore, candy lends itself to other tasks, such as deciding whether to trade the bag with a friend see Exercise 2 We stated earlier that the bags of candy are very large; otherwise, the assumption fails to hold.
9 Technically, it is more correct (but less hygienic) to rewrap each candy after inspection and return it to the bag. 714 Chapter 20. STATISTICAL LEARNING METHODS 1 1. Posterior probability of hypothesis Probability that next candy is lime P(h1 | d). P(h2 | d). P(h3 | d) P(h4 | d). P(h5 | d) 0 0 2 4 6 8 10 0 2 4 6 8 10. Number of samples in d Number of samples in d (a) (b). Figure (a) Posterior probabilities P (hi |d1 , .. , dN ) from Equation ( ). The num- ber of observations N ranges from 1 to 10, and each observation is of a lime candy. (b). Bayesian prediction P (dN +1 = lime|d1.)
10 , dN ) from Equation ( ). lime candies are unwrapped, h4 is most likely; after 3 or more, h5 (the dreaded all-lime bag). is the most likely. after 10 in a row, we are fairly certain of our fate. Figure (b) shows the predicted probability that the next candy is lime, based on Equation ( ). As we would expect, it increases monotonically toward 1. The example shows that the true hypothesis eventually dominates the Bayesian predic- tion. This is characteristic of Bayesian LEARNING . For any fixed prior that does not rule out the true hypothesis, the posterior probability of any false hypothesis will eventually vanish, sim- ply because the probability of generating uncharacteristic data indefinitely is vanishingly small.