Transcription of 2009 California Residential Appliance Saturation Study ...
1 2009 California Residential Appliance Saturation Study Executive Summary Prepared for: California energy commission Prepared by: KEMA, Inc. CONSULTANT REPORT OCTOBER 2010 CEC 200 2010 004 ES Prepared by: Primary Author(s): KEMA, Incorporated Claire Palmgren, Project Manager Noel Stevens Miriam Goldberg, Rich Barnes Karen Rothkin, KEMA, Inc. 155 Grand Avenue, Suite 500 Oakland, CA 94612 Contract Number: 400-07-031 Prepared for: California energy commission Glen Sharp Gary Occhiuzzo Contract Managers Glen Sharp Project Manager Bill Junker Office Manager Demand Analysis Office Sylvia Bender Deputy Director Electricity Supply Analysis Division Melissa Jones Executive Director DISCLAIMER This report was prepared as the result of work sponsored by the California energy commission .
2 It does not necessarily represent the views of the energy commission , its employees or the State of California . The energy commission , the State of California , its employees, contractors and subcontractors make no warrant, express or implied, and assume no legal liability for the information in this report; nor does any party represent that the uses of this information will not infringe upon privately owned rights. This report has not been approved or disapproved by the California energy commission nor has the California energy commission passed upon the accuracy or adequacy of the information in this report. i ACKNOWLEDGEMENTS Los Angeles Department of Water and Power (LADWP) Michael Cockayne Jaimi Johnson Pacific Gas and Electric (PG&E) Rafael Friedmann San Diego Gas & Electric (SDG&E) Eric Drabb Southern California Edison (SCE) Reginald Wilkins Southern California Gas Company (SoCal Gas) George Katsufrakis ii iii ABSTRACT In 2009 , the California energy commission funded and administered a Residential Appliance Saturation Study that serves as an update to the 2003 RASS, with the same utilities participating Pacific Gas and Electric Company (PG&E), Southern California Edison (SCE), San Diego Gas & Electric Company (SDG&E)
3 , Southern California Gas Company (SoCal Gas), and Los Angeles Department of Water and Power (LADWP). KEMA was the prime consultant. The Study was implemented as a mail survey with an option for respondents to complete it on line. The survey requested households to provide information on appliances , equipment, and general consumption patterns. Data collection was completed in early 2010. The Study yielded energy consumption estimates for 27 electric and 10 natural gas Residential end uses and Appliance saturations for households. These consumption estimates were developed using a conditional demand analysis, an approach that applied statistical methods to combine survey data, household energy consumption data and weather information to calculate average annual consumption estimates per Appliance .
4 The 2009 RASS resulted in end use saturations for 24,464 individually metered and 1,257 master metered households. Survey and conditional demand analysis results were weighted to provide population level estimates representative of the participating utilities that allow comparison across utility service territories, forecast climate zones and other variables of interest dwelling type, dwelling age group, and income. Keywords: California energy commission , conditional demand analysis, CDA, unit energy consumption, UEC, Residential , Appliance , saturations, degree day normalization, energy survey, data collection Please use the following citation for this report: KEMA, Inc.
5 2010. 2009 California Residential Appliance Saturation Study . California energy commission . Publication number: CEC 200 2010 004 ES. iv v TABLE OF CONTENTS Acknowledgements .. i ABSTRACT .. iii TABLE OF CONTENTS .. v List of Figures .. v List of Tables .. vii EXECUTIVE SUMMARY .. 1 Study Overview .. 1 Unit energy Consumption and Appliance Saturation 2 Electricity Consumption and UECs .. 2 Natural Gas consumption and UECs .. 9 Fuel Shares .. 13 Air Conditioning .. 19 New Dwellings .. 26 Income Effects .. 31 Adoption of energy Efficient Measures .. 33 Technology .. 39 Data Comparisons .. 44 Effect of Combining the Main Sample and Non Response Follow Up Sample.
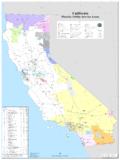
6 44 List of Acronyms .. 46 LIST OF FIGURES Figure ES 1: Statewide Electricity Consumption per Household .. 3 Figure ES 2: California energy commission Forecast Climate Zones .. 6 Figure ES 3: Electric UECs by Forecast Climate Zone .. 7 Figure ES 4: Home Types by Forecast Climate Zones .. 8 Figure ES 5: Electric UECs by Dwelling Type .. 8 Figure ES 6: Statewide Natural Gas energy Consumption .. 9 vi Figure ES 7: Natural Gas UECs by Gas Utility .. 10 Figure ES 8: Combined Electric, Natural Gas, and Other Fuel Saturations .. 12 Figure ES 9: Overall Shares of Electric and Gas Systems .. 13 Figure ES 10: Primary Space Heating Fuel .. 14 Figure ES 11: Space Heating Fuel by Dwelling Type.
7 14 Figure ES 12: Space Heating Fuel by Dwelling Age .. 15 Figure ES 13: Saturation of Electric Space Heating by Forecast Climate Zone .. 15 Figure ES 14: Water Heating Fuel by Dwelling Type .. 16 Figure ES 15: Electric appliances Share by Dwelling Age .. 17 Figure ES 16: Fuel Shares for Dryers by Dwelling Type .. 18 Figure ES 17: Fuel Shares for Ranges by Dwelling Type .. 18 Figure ES 18: Fuel Shares for Ovens by Dwelling Type .. 19 Figure ES 19: Air Conditioning UECs by AC Type for RASS Studies .. 20 Figure ES 20: AC UEC and Cooling Degree Days (CDD) by Forecast Climate Zone .. 21 Figure ES 21: Saturation of Air Conditioning by Forecast Climate Zone .. 22 Figure ES 22: Air Conditioning by Dwelling Type for All Forecast Climate Zones Except 5 and 11.
8 23 Figure ES 23: Air Conditioning Type by Dwelling Age .. 23 Figure ES 24: Air Conditioning Type by Income .. 24 Figure ES 25: Age Distribution of Central Air Conditioners .. 24 Figure ES 26: Air Conditioning Setback Habits .. 25 Figure ES 27: Presence and Type of Programmable Thermostats by Setback Habits .. 26 Figure ES 28: Distribution of New Dwellings by energy commission Forecast Climate Zone .. 27 Figure ES 29: Housing Growth Rate by Forecast Climate Zone .. 27 Figure ES 30: Electric UECs for Newer and Older Dwellings .. 28 Figure ES 31: Electric UECs for Newer and Older Dwellings by Dwelling Type .. 29 Figure ES 32: Natural Gas UECs for Newer and Older Dwellings .. 29 Figure ES 33: Natural Gas UECs for Newer and Older Dwellings by Dwelling Type.
9 30 Figure ES 34: Average Electricity and Natural Gas Consumption by Income .. 32 vii Figure ES 35: Electricity Consumption Compared With Income .. 33 Figure ES 36: energy Efficiency Measures by Ownership .. 34 Figure ES 37: Ownership by Dwelling Type .. 35 Figure ES 38: energy Efficiency Measures by Dwelling Age .. 35 Figure ES 39: Dwelling Type by Dwelling Age .. 36 Figure ES 40: Remodeling and Repair Opportunities .. 36 Figure ES 41: Penetration of Various Lighting Equipment and Devices .. 37 Figure ES 42: Penetration of CFLs and Incandescents by Home Area .. 38 Figure ES 43: First Refrigerators by Size and Age .. 38 Figure ES 44: Second and Third Refrigerators by Size and Age.
10 39 Figure ES 45: Penetration of Technology Equipment .. 40 Figure ES 46: Types of Televisions .. 40 Figure ES 47: Hours of Television Use by Size of Television .. 41 Figure ES 48: Use of Computer .. 41 Figure ES 49: Electricity Consumption by Amount of Home Office Use .. 42 Figure ES 50: Technology by Income .. 42 Figure ES 51: Number of Vehicles by Income .. 43 Figure ES 52: Availability of Power Outlet near Vehicle Parking by Home Type .. 43 LIST OF TABLES Table ES 1: Electric UECs and Appliance Saturation Summaries by Electric Utility .. 4 Table ES 2: Electric UECs and Appliance Saturation Summaries by Dwelling Type .. 5 Table ES 3: Natural Gas UEC and Appliance Saturation Summaries by Utility.