Example: barber
2009 HHS Poverty Guidelines
Poverty Guidelines Threshold Interval Chart for FFY 2009 . 48 Contiguous States and D.C. ACF-700 Data Field . 7a : At or below poverty threshold* 7b : Above threshold but below 150% of threshold . 7c : Above 150% of threshold and below 200% of threshold . 7d : Above 200% of threshold .
Tags:
Information
Domain:
Source:
Link to this page:
Documents from same domain
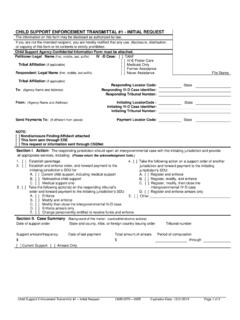
CHILD SUPPORT ENFORCEMENT TRANSMITTAL …
www.acf.hhs.govCHILD SUPPORT ENFORCEMENT TRANSMITTAL #1 - INITIAL REQUEST, PAGE 2. Section II. Case Summary (Continued): Date of support o rder State and county, t ribe, or foreign country issuing o rder Tribunal number
Child Maltreatment 2014
www.acf.hhs.govChild Maltreatment 2014 DEPARTMENT OF HEALTH & HUMAN SERVICES. ADMINISTRATION FOR CHILDREN AND FAMILIES …
Child Maltreatment 2012 - acf.hhs.gov
www.acf.hhs.govThe 1988 CAPTA amendments directed the U.S. Department of Health and Human Services to establish a national data collection and analysis program.
www.acf.hhs.gov
www.acf.hhs.govTechnical Supplement to the Health Profession Opportunity Grants (HPOG) Impact Study Interim Report: Report Appendices OPRE Report 2018-16b . May 2018 . …
Advantages and Disadvantages of Collaboration in …
www.acf.hhs.govAdvantages and Disadvantages of Collaboration in Child Welfare: Results from 24 Demonstration Grants Jennifer Dewey, PhD Grace Atukpawu, PhD Kate Lyon, MA
The Child Abuse Prevention and Treatment Act 2010
www.acf.hhs.govThe basis for government's intervention in child ... The Child Abuse Prevention and Treatment Act ... CAPTA, in its original inception, was signed into law on ...
A National Look at the Use of Congregate Care in …
www.acf.hhs.govIII. A National Look at the Use of Congregate Care in Child Welfare. Similar to the PIT results, the majority of the children in the 2008 cohort …

Handbook on Child Support Enforcement
www.acf.hhs.govHANDBOOK ON CHILD SUPPORT ENFORCEMENT ... other law enforcement agencies, ... is a guide to help you get
Qualitative Research Methods in Program …
www.acf.hhs.govQUALITATIVE RESEARCH METHODS IN PROGRAM EVALUATION: CONSIDERATIONS FOR FEDERAL STAFF Office of Data, Analysis, Research & Evaluation Administration on Children, Youth & Families
Measuring the Impact of Healthy Food Projects
www.acf.hhs.govMeasuring the Impact of Healthy Food Projects. About Reinvestment Fund Our mission is to build wealth and opportunity for low-wealth people and places through the promotion of socially and environmentally responsible development. ... Measuring the Economic Impact
Related documents
Copyright 1994 by National Clearinghouse for Legal ...
povertylaw.orgThe "poverty guidelines," which are issued annually by HHS, are a modification of the poverty thresholds but are still based upon the faulty food-to-nonfood calculation used to calculate the poverty threshold.
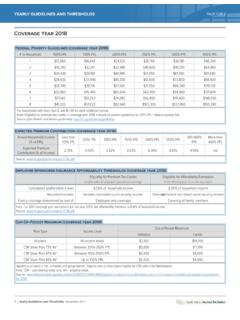
Coverage Year 2018 - Beyond the Basics
www.healthreformbeyondthebasics.orgFederal Poverty Guidelines (coverage year 2018) EA GEE A EO PAGE 2 OF 2 2 | Yearly Guidelines and Thresholds, ... Tax Filing Status Tax Filing Threshold for People Under Age 65 Single $10,400 Head of Household $13,400 Married Filing Jointly $20,800 Married Filing Separately $4,050 Qualifying Widow(er) w/ Qualifying Child $16,750 Tax Dependent ...
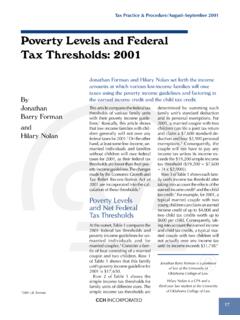
Poverty Levels and Federal Tax Thresholds: 2001 - OU Law
jay.law.ou.eduPoverty Levels and Federal Tax Thresholds: 2001 By Jonathan Barry Forman and Hilary Nolan ... taxes using the poverty income guidelines and factoring in ... tax threshold (before credits) 12,450 15,350 18,250 21,150 3. Income tax threshold after the earned income
Florida’s Families and Children Below the Federal Poverty ...
edr.state.fl.usFlorida’s Families and Children Below the Federal Poverty Level Florida Senate ... – The poverty threshold is the cost of a minimum annual food diet in 1963 (times 3 to allow for other expenses) in today’s prices. ... poverty (income below 50% of the poverty level).
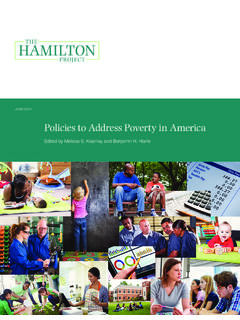
2018 HHS Poverty Guidelines
www.dllr.maryland.govor is a part of a household that is below the federal minimum poverty level and likely to remain there for the foreseeable future. 2018 HHS Poverty Guidelines Persons in Family 48 Contiguous States and D.C. Alaska Hawaii 1 $12,140.00 $15,180.00 $13,960.00 2 $16,460.00 $20,580.00 $18,930.00 3 $20,780.00 $25,980.00 $23,900.00
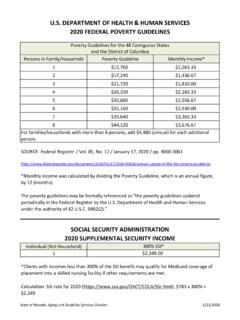
Policies to Address Poverty in America - Hamilton Project
www.hamiltonproject.orgthreshold. As has been highlighted in earlier Hamilton Project work, 29.6 percent of families live within 150 percent of the poverty line; nearly half live within 250 percent of the ... 6 Policies to Address Poverty in America Introduction born into deprivation will live their lives stuck in a perpetual poverty …
U.S. DEPARTMENT OF HEALTH & HUMAN SERVICES 2018 …
adsd.nv.govThe poverty guidelines may be formally referenced as “the poverty guidelines updated periodically in the Federal Register by the U.S. Department of Health and Human Services under the authority of …
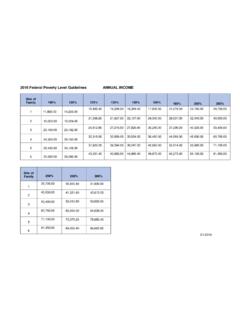
2016 Federal Poverty Level Guidelines ANNUAL INCOME
www.eohhs.ri.gov2016 Federal Poverty Level Guidelines ANNUAL INCOME . 41,331.60. 3/1/2016 . Size of Family 100% 120% 133% 135% 138% 150% 185% 200% 250%
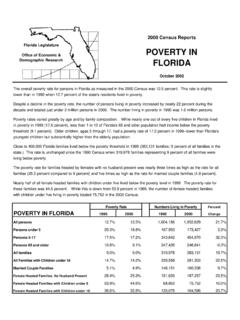
POVERTY IN FLORIDA - EDR
edr.state.fl.usin poverty in 1999 (17.6 percent), less than 1 in 10 of Florida's 65 and older population had income below the poverty threshold (9.1 percent). Older children, ages 5 through 17, had a poverty rate of 17.2 percent in 1999--lower than Florida's
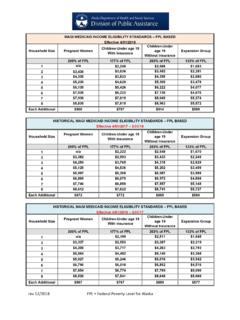
rev 03/2018 FPL = Federal Poverty Level for Alaska
dpaweb.hss.state.ak.usrev 03/2018 FPL = Federal Poverty Level for Alaska . MAGI MEDICAID INCOME ELIGIBILITY STANDARDS – FPL BASED Effective 4/01/2018 Household Size . Pregnant Women . Children-Under age 19 . With Insurance : Children-Under age 19 Without Insurance Expansion Group .
Related search queries
Copyright 1994 by National Clearinghouse, Poverty guidelines, Poverty, Poverty threshold, Coverage year 2018, Guidelines, Threshold, Poverty Levels and Federal Tax Thresholds: 2001, Families and Children Below the Federal Poverty, Policies to Address Poverty in America, DEPARTMENT OF HEALTH & HUMAN SERVICES, 2016 Federal Poverty Level Guidelines ANNUAL, POVERTY IN FLORIDA, Federal Poverty Level for Alaska