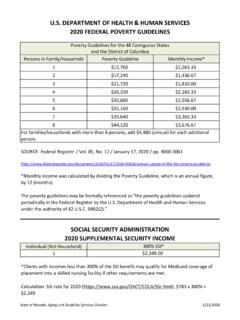
Transcription of POVERTY IN FLORIDA - EDR
1 The overall POVERTY rate for persons in FLORIDA as measured in the 2000 Census was percent. This rate is slightlylower than in 1990 when percent of the state's residents lived in a decline in the POVERTY rate, the number of persons living in POVERTY increased by nearly 22 percent during the decade and totaled just under 2 million persons in 2000. The number living in POVERTY in 1990 was million rates varied greatly by age and by family composition. While nearly one out of every five children in FLORIDA livedin POVERTY in 1999 ( percent), less than 1 in 10 of FLORIDA 's 65 and older population had income below the povertythreshold ( percent). Older children, ages 5 through 17, had a POVERTY rate of percent in 1999--lower than FLORIDA 'syoungest children but substantially higher than the elderly to 400,000 FLORIDA families lived below the POVERTY threshold in 1999 (383,131 families; 9 percent of all families in thestate.)
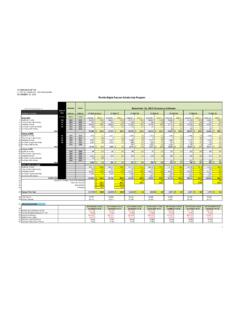
2 This rate is unchanged since the 1990 Census when 319,978 families representing 9 percent of all families were living below POVERTY rate for families headed by females with no husband present was nearly three times as high as the rate for allfamilies ( percent compared to 9 percent) and five times as high as the rate for married couple families ( percent).Nearly half of all female headed families with children under five lived below the POVERTY level in 1999. The POVERTY rate for these families was percent. While this is down from percent in 1989, the number of female-headed familieswith children under five living in POVERTY totaled 75,752 in the 2000 IN FLORIDA1990200019902000 ChangeAll ,604,1861,952, under ,953173, ,642454, 65 and ,426246, ,978383, Families with Children under ,558281, Couple ,151160, Headed Families, No Husband ,639187, Headed Families with Children under 68,85275, Headed Families with Children under ,078164.
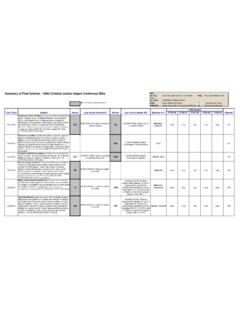
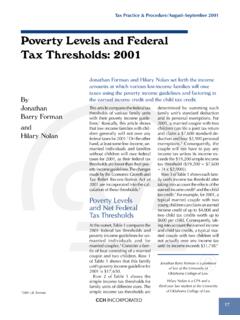
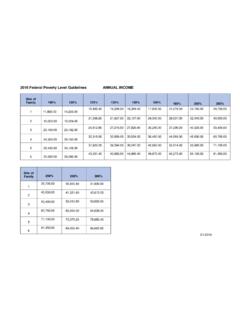
3 POVERTY RateNumbers Livng in Poverty2000 Census ReportsPOVERTY INFLORIDAO ctober 2002 FLORIDA LegislatureOffice of Economic &Demographic ResearchRANK1 Hamilton Johns Johns Johns Johns rates in 1999, as measured in the 2000 Census, varied substantially by county. Rates for all persons and selectedage groups and family configurations are shown on the following page. Numbers shaded in yellow are the highest and those shaded in green are the lowest for each POVERTY variable the overall POVERTY rate for persons in FLORIDA was percent, county rates ranged from a low of percent in ClayCounty to a high of 26 percent in Hamilton County. Similar trends can be observed in each of the POVERTY measures--county rates range, in most cases, from below ten percentto four or five times that level.
4 There are some notable exceptions. The rates for married couple families range from a low of percent in St. Johns County to a high of percent in Hardee County which, while still low, is six times the lowest level. Female-headed households faced high levels of POVERTY even in affluent counties. For example, Seminole County, with thelowest rate statewide in four of the ten POVERTY variables still had a POVERTY rate of percent for female-headed households,of percent for female-headed households with children under 18, and of percent for female-headed householdswith children under counties have the highest POVERTY rate for many of the variables shown but Hamilton County has the highest rate for seven of the ten different POVERTY variables. In those cases where Hamilton County's rate is not the highest, it is close to thehighest.
5 As noted above, Seminole County has the lowest rates in the state for four of the ten POVERTY HEADED FAMILIES WITH CHILDREN UNDER 5 PERSONS 65 & OLDERCOUNTIES WITH HIGHEST AND LOWEST POVERTY RATESFOR SELECTED VARIABLESALL PERSONSPERSONS UNDER 5 ALL FAMILIESFEMALE HEADED FAMILIESPOVERTY RATES IN FLORIDA --From Census 2000 Female HeadedFemale HeadedAll FamiliesMarriedFemaleFamily withFamily withAllPersonsPersonsPersonsAllwith ChildrenCoupleHeadedChildrenChildrenCoun tyPersonsunder 55 to 1765 and olderFamiliesunder 18 FamiliesFamiliesunder 5under 18 Alachua River Beach Johns Lucie Rosa : 2000 Census of Population and Housing, Summary File 3.
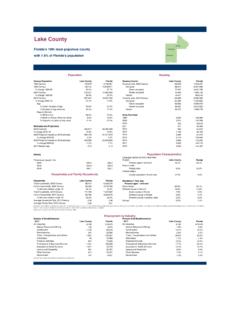
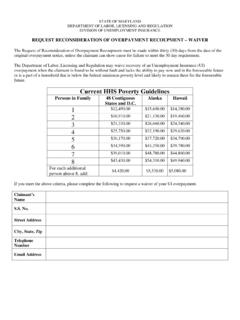
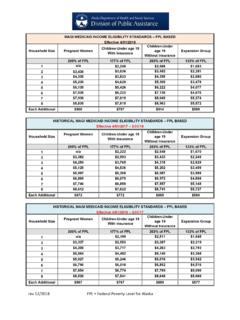
6 As shown above, POVERTY rates vary greatly by race. Individuals who reported that their race was black alone were more likely to be living below the POVERTY level at all ages. Black rates ranged from times the white rate at ages 18-64 up to times the white rate at ages 65-74. Povertyrates for persons of all other races (including individuals who reported more than one race) fellbetween the rates for whites and blacks. POVERTY STATUS FOR PERSONS IN 1999 BY RACE AND AGEW hiteBlackAll otherIncome below POVERTY levelTOTALA loneAloneraces Under 5 years173,427 80,197 69,548 23,682 5 years35,320 15,866 14,971 4,483 6 to 11 years222,734 104,025 92,748 25,961 12 to 17 years196,516 95,011 76,466 25,039 18 to 64 years1,077,991 670,254 276,298 131,439 65 to 74 years117,108 86,595 23,527 6,986 75 years and over129,533 107,955 17,554 4,024 ALL AGES 1,952,629 1,159,903 571,112 221.
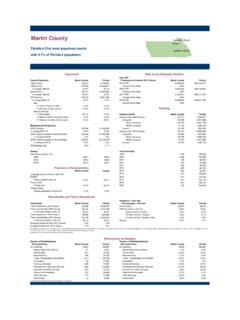
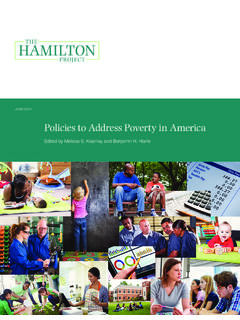
7 614 WhiteBlackAll otherPoverty RatesTOTALA loneAloneraces Under 5 5 6 to 11 12 to 17 18 to 64 65 to 74 75 years and AGES : 2000 Census of Population and Housing, Summary File 3, Tables P-159A-GPoverty Rates by Race and +Age GroupTOTALW hiteBlackAll other races Black WhiteTotalOtherPoverty rates also vary by ethnic origin. Floridians who are of Hispanic origin were more likely to beliving in POVERTY than persons who were not of Hispanic origin. POVERTY rates for Hispanics fall between the rates for whites and blacks and range from 16 percent for persons in the working ages (18-64) upto nearly 23 percent for those under five years of age. The POVERTY rate for all Hispanics is times the rate for HispanicIncome below POVERTY levelTOTALO riginOrigin Under 5 years173,427 42,774 130,653 5 years35,320 8,317 27,003 6 to 11 years222,734 51,691 171,043 12 to 17 years196,516 48,225 148,291 18 to 64 years1,077,991 268,931 809,060 65 to 74 years117,108 28,743 88,365 75 years and over129,533 24,294 105,239 ALL AGES 1,952,629 472,975 1,479.
8 654 HispanicNot HispanicPoverty RatesTOTALO riginOrigin Under 5 5 6 to 11 12 to 17 18 to 64 65 to 74 75 years and AGES : 2000 Census of Population and Housing, Summary File 3, Tables P-159A-GPOVERTY STATUS BY AGE AND HISPANIC ORIGINP overty Rates by Hispanic Origin and Age +TotalHispanicNot HispanicTotalNot HispanicHispanicThe following table shows the ratio of income in 1999 to the POVERTY level. Persons with ratios under wereliving below the POVERTY line and those with ratios of or higher were living above the POVERTY line. Thepercentage distribution shown in the table from the 2000 Census is very similar to the one obtained in the 1990 Census. Less than six percent of Floridians had an income that was less than half of the POVERTY threshold ( in 2000 and percent in 1990).
9 In 2000, percent of persons had income that was less than 125 percent of POVERTY and percent had income that was less than 150 percent of POVERTY . Correspondingnumbers for 1990 were percent (less than 125 percent of POVERTY ) and percent (less than 150 percentof POVERTY ). In 1990, 68 percent of Floridians had income that was at least twice as high as the POVERTY 2000, this had increased to PercentUnder .50888,104 to .74478,536 to .99585,989 to ,631 to ,568 to ,574 to ,198 to ,810 and over10,744,957 15,605,367 : 2000 Census of Population and Housing, Summary File 3, Tables OF INCOME IN 1999 TO POVERTY LEVEL FOR PERSONSRATIO OF INCOME TO POVERTYR atio of Income in 1999 to POVERTY Level: FLORIDA -2,000,0004,000,0006,000,0008,000 ,00010,000,00012,000,000 Under.
10 5050 to .7475 to . to to to to to and overRatio of Income to PovertyNumber of PersonsThe data presented in this report were obtained from the 2000 Decennial Census, summary file out of every six households surveyed for the 2000 Census was asked detailed questions concerningmoney income during 1999. Total income figures for families and unrelated individuals were obtained by adding responses given for wage or salary income; net self-employment income; interest, dividend, or netrental or royalty income or income from estates and trusts; social security or railroad retirement income;Supplemental Security Income (SSI); public assistance or welfare payments; retirement, survivor, ordisability pensions; and all other value of in-kind income such as food stamps, public housing subsidies, and medical care was notcounted as status was determined by comparing the person's total family income with a POVERTY thresholdappropriate for that person's family size and composition.