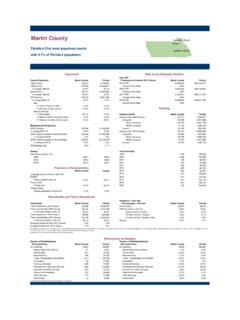
Transcription of Lake County - edr.state.fl.us
1 1980 Census104,8709,746,961 Housing units, 2000 Census102,8307,302,9471990 Census152,10412,938,071 Occupied88,4136,337,929 % change ,0474,441,7992000 Census210,52715,982,824 Renter-occupied16,3661,896,130 % change ,417965,0182010 Census297,04718,801,332 Housing units, 2010 Census144,9968,989,580 % change ,2897,420,802 AgeOwner-occupied92,8024,998,979% Under 18 years of ,4872,421,823% 65 years of age and ,7071,568,778 Race & Ethnicity% White Permitted% Black or African American ,205126,384% Hispanic or Latino (of any race)
2 ,231155,269201055238,679 Estimates and Projections201151742,3602018 Estimate342,91720,840,568201294264,810% change ,73086,7522020 Projection based on 2018 estimate360,73921,517,61020142,48884,075 % change ,778109,9242025 Projection based on 2018 estimate402,06523,050,82020163,966116,24 0% change ,360122,7192017 Median ,330144,427 DensityPersons per square mileLanguage spoken at home other than EnglishLake aged 5 and of Veteran statusCivilian population 18 and Total households, 2000 Census88,4126,338,075 Family households, 2000 Census62,4684,210,760 Same % with own children under house in the Total households, 2010 Census121,2897,420,802 Same County in Family households, 2010 Census83,7924,835,475 Different County in % with own children under County in another Average Household Size, 2010 Average Family Size, 2010 of Establishments 2017 lake CountyFloridaPercent of All Establishments 2017 lake CountyFloridaAll industries8,180679,976 All industries8,180679,976 Natural Resource & Mining1525.
3 274 Natural Resource & ,15568, , , Transportation and Utilities1,687139,467 Trade, Transportation and , Activities84772,393 Financial & Business Services1,444159,259 Professional & Business & Health Services1,07172,778 Education & Health and Hospitality69455,767 Leisure and Services61355,357 Other , may not add to the total due to confidentiality and CharacteristicsEmployment by IndustryAccording to Census definitions, a household includes all of the people who occupy a housing unit. The occupants may be a single family, one person living alone, two or more families living together, or any other group of related or unrelated people who share living quarters.
4 A family includes a householder and one or more other people living in the same household who are related to the householder by birth, marriage, or counts may be corrected for Census Count Question Resolution (CQR). lake CountyFlorida's 19th most populous countywith of Florida's populationHouseholdsLake CountyHousing CountsCensus PopulationFloridaPopulationHousingLake CountyFloridaLake CountyResidence 1 Year Ago Persons aged 1 and overFloridaHouseholds and Family HouseholdsLake CountyAll industries95,7598,495,250 All industries$36,595$48,452 Natural Resource & Resource & Mining$37,914$32, $45,980$49, $44,244$59,389 Trade, Transportation and , Transportation and Utilities$32,666$43, $44,437$80,303 Financial Activities$45,565$72.
5 712 Professional & Business & Business Services$37,435$58,701 Education & Health & Health Services$43,741$49,450 Leisure and and Hospitality$17,485$24,901 Other Services$27,415$35, $42,790$53,214 Industries may not add to the total due to confidentiality and $2,693,422$260,093,5681990$17,550$19,956 2000$5,589,244$477,315,9982000$26,321$29 ,744% change change $9,626,253$725,801,1402010$32,335$38,511 % change change $9,971,759$766,185,8382011$33,183$40,120 % change change $10,391,097$791,918,5532012$34,200$40,94 4% change change $10,683,217$794,796,9802013$34,669$40,58 2% change change $11,543,310$858,498,6602014$36,555$43,14 6% change change $12,314,077$919,226,9242015$37,808$45,35 2% change change $13,255,204$953,260,6142016$39,517$46,14 8% change change $14,027,796$1,000,624,0652017$40,541$47, 684% change change by Place of Work ($000s)
6 Median Income1990$1,146,044$161,317,329 Median Household Income$49,734 $50,883 2000$2,385,594$313,054,047 Median Family Income$60,130 $61,442 % change $3,841,893$438,991,235% change in Poverty, 20172011$3,968,128$450,502,115 All ages in change age 18 in $4,226,233$468,412,894 Ages 5-17 in families in change $4,342,777$482,900,406% change $4,586,657$512,331,048% change (state total includes special districts)533,1862015$4,976,915$545,122, 402 Elementary251,898% change $5,166,029$567,712,460 Senior High10708% change $5,382,673$596,159,864% change Period Ending Dec.
7 31, HS graduate or 12-Month Period Ending Dec. 31, bachelor's degree or State Rank5 NACrime rate, 2018 (index crimes per 100,000 population)2, , of Work in FloridaAdmissions to prison FY 2017-1827927,917 Worked outside County of Travel Time to travel time to work (minutes) lake CountyFloridaWorkers Aged 16 and OverPublic Education Schools Traditional Setting (2018-19) lake County School DistrictFloridaPersonal Bankruptcy Filing Rate (per 1,000 population) lake CountyFloridaChapter 7 & Chapter 13 CrimeLake CountyFloridaAdmissions to prison per 100,000 population FY 2017-18 lake CountyEducational attainment Persons aged 25 and olderQuality of LifePersonal Income ($000s)
8 Per Capita Personal IncomeLake CountyLake County Income and Financial HealthEducationFloridaFloridaLake CountyFloridaLake CountyPage 2 lake CountyAverage Annual Wage 2017 FloridaFloridaLabor Force as Percent of Population Aged 18 and OlderLabor ForceEmployment by IndustryAverage Annual Employment, % of All Industries, 2017 Unemployment RateFloridaFloridaLake CountyLake CountyTotal - All Revenue Account Codes ($000s)$312, $40,323, - All Expenditure Account Codes ($000s)$324, $38,724, Capita $$ $2, Capita $$1, $2, of of ($000s)$127, $12,835, Government Services** ($000s)$70, $7,520, Capita $$ $ Capita $$ $ of of , Fee, and Special Assessments ($000s)$25, $1,732, Safety ($000s)$129, $9,077, Capita $$ $ Capita $$ $ of of Revenues ($000s)$46, $4,079, Environment ($000s)$21, $4,450, Capita $$ $ Capita $$ $ of of for Services ($000s)$77, $12,526, ($000s)$32, $4,573, Capita $$ $ Capita $$ $ of of , Fines, and Forfeits ($000s)$2, $202, Environment ($000s)
9 $7, $1,451, Capita $$ $ Capita $$ $ of of Revenues ($000s)$2, $908, Services ($000s)$9, $3,212, Capita $$ $ Capita $$ $ of of Sources ($000s)$30, $8,039, / Recreation ($000s)$11, $1,496, Capita $$ $ Capita $$ $ of of Uses and Non-Operating ($000s)$29, $6,041, Capita $$ $ of ** (Not Court-Related)Court-Related Expenditures ($000s)$11, $900, Capita $$ $ of HighwayCounty-WideNot County -Wide*Centerline Miles , , 606,929 Special *MSTU included in Not County -Wide " County " categoryState FacilitiesBuildings/Facilities (min.)
10 300 Square Feet)Number1539,498 Square Footage543,60564,170,217 State Owned LandsState LandsConservation LandsParcels20838,326 Acreage55, ,140, LandsParcels615, , CountyFloridaPrepared by: Florida LegislatureOffice of Economic and Demographic Research111 W. Madison Street, Suite 574 Tallahassee, FL 32399-6588 (850) 487-1402 June 2019 Page 3 TransportationState and Local Taxation2018 Ad Valorem Millage Rates lake CountyReported County Government Revenues and ExpendituresRevenue 2015-16 lake County * All County Governments Except Duval - The consolidated City of Jacksonville / Duval County figures are included in municipal totals rather than County government *Expenditures 2015-16 lake CountyFlorida*State Infrastructur
