Transcription of 2013 RECREATIONAL BOATING - Overblog
1 CENTER OF KNOWLEDGE RECREATIONAL BOATING Statistical Abstract 2013$ 1,500 RECREATIONAL BOATING Statistical Abstract 2014 national MARINE manufacturers ASSOCIATIONThe entire content of this report is the exclusive property of NMMA, with all rights reserved. No reproduction of any kind may be made without the express permission of 2014 NMMA All rights reserved. No reproduction of any kind may be made without the express permission of 2013 RECREATIONAL BOATING Statistical Abstract is a comprehensive summary of statistics on the RECREATIONAL BOATING industry in the United States. The data herein has been collected by the national Marine manufacturers association (NMMA) from a coalition of sources brought together by the NMMA Industry Statistics & Research Department.
2 These partnerships form a Center of Knowledge for marine industry statistics and research that enables NMMA to provide the industry with timely, accurate data and analysis of the marine report presents detailed data for boat registrations, sales, expenditures, participation and the retail market. BOATING Population includes BOATING participation, ownership, usage and behavior data from boater participation and boat owner surveys conducted by Foresight Research in late 2013. The Import/Export section features an in-depth look at the import/export marketplace focusing on product categories, trade partners and regional analysis. Section 18 details the results of a consumer survey conducted by Foresight Research in 2013 on boaters marine accessory spending habits.
3 NMMA s Industry Statistics & Research Department analyzed and formatted all data in this report. The complete list of sources can be found on page 2014 NMMA All rights reserved. No reproduction of any kind may be made without the express permission of of NMMA Resources in the Center of Knowledge Mission: Bring together a coalition of resources for marine industry statistics and research to provide industry stakeholders, the press and the general public with current, valid and reliable information on the RECREATIONAL BOATING industry. IMPORT/EXPORT DATA REGISTRATIONS INTERNATIONA ECONOMIC IMPACT CONSUMER RESEARCH NMMA S CENTER OF COAST GUARDDEPT.
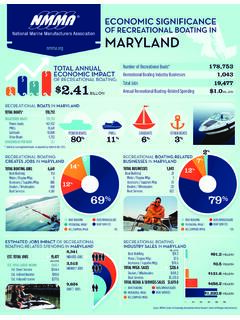
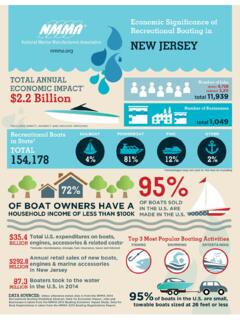
4 OF COMMERCESMGARVIARBFFNSGAAMIASARSM MCGLADNEYFORESIGHTRESEARCHLEFT-BRAINMARK ETINGSTATISTICALSURVEY INCINFO-LINKTECHNOLOGIESRMRCICOMIA BOATER PANEL ITR ECONOMICS INDUSTRY ASSOCIATIONS FINANCE OPERATIONS INDUSTRY FORECAST national CONSUMER PANEL MARKETING RESEARCH, STATE REGISTRATIONS NEW POWERBOAT SALES BELLWEATHER REPORTS IV 2014 NMMA All rights reserved. No reproduction of any kind may be made without the express permission of SnapshotRecreational BOATING continues to be an important factor to the economy contributing $ billion in direct sales of products and services in 2013 a three percent increase compared to 2012.
5 This is the third year of growth since the industry s low point of the great recession in 2010 when sales of products and services totaled $ billion. The industry s high mark was set in 2006 at $ and pre-owned boat and engine retail sales totaled $ billion in 2013, a six percent increase compared to the 2012. The high point for total sales was set in 2006 at $ billion and the low mark was set in 2011 at $ sales of new boats and engines in 2013 totaled $ billion a five-year high and a 10 percent increase compared to 2012. Sales of new traditional powerboats (outboard, inboard, sterndrive and jet boats) grew 12 percent in 2013 to $ billion. The high point of traditional powerboat sales was set in 2006 at $ billion and the low point was set in 2010 at $ billion.
6 Retail sales of new outboard engines reached a six-year high in 2013 and totaled $ billion a seven percent increase compared to 2012. The high point for new outboard engine sales was set in 2006 at $ billion and the low point was set in 2009 at $ power and sailboat sales in 2013 totaled $ billion a three percent increase from 2012. This is the highest total since 2006 before the great recession when sales totaled $ billion. Sales of pre-owned outboard engines reached an all-time high $ billion in 2013 a five percent increase compared to the previous the 242 million adults living in the United States in 2013, 89 million people participated in RECREATIONAL BOATING at least once during the year a one percent increase from 2012.
7 This is the highest level of participation in RECREATIONAL BOATING since NMMA began collecting participation data in were 960 thousand traditional powerboats (new and pre-owned) sold in 2013, a less than one percent decline compared to 2012. In units, new traditional powerboat sales increased two percent to 161 thousand boats and pre-owned traditional powerboat sales declined one percent to 799 thousand boats. There was a slight movement in the ratio of new to pre-owned sales for the second consecutive year in 2013, 17 percent to 83 percent, respectively; however, the ratio of new to pre-owned sales has not recovered to pre-recession levels or the industry high mark of 31 percent new to 69 percent pre-owned set in percent of the new traditional powerboats sold were manufactured in the United States, a total of 152 thousand traditional powerboats.
8 This is a two percent increase compared to unit sales for all new boats (power, sail and paddle) declined three percent in 2013 to 532 thousand units. This decline was led primarily by the paddle segment which was down six percent (18 thousand units), followed by jet boats down 33 percent (1,500 units) and sterndrive boats down eight percent (1,400 units). On the bright side outboard boats were up five percent (six thousand units), inboard ski/wakeboard boats up 11 percent (600 units), inboard cruisers up 10 percent (200 units) and personal watercraft up two percent (900 units).New outboard engine unit sales increased three percent to 198 thousand engines; the greatest number of units sold since 2008, but still 151 thousand engines below the all-time high mark set in 2000 when 349 thousand outboard engines were boat trailer sales increased 11 percent to 86 thousand units; corresponding dollar sales totaled $148 million a 12 percent increase compared to 2012.
9 Unit sales in 2013 were the highest since 2008 when 92 thousand trailers were accessory sales total $ billion in 2013, a 12 percent decline compared to the previous year. Consequently, the average spent on accessories per boat in 2013 was $309, down $43 from the previous year. More than seven of 10 (72 percent) power and sail boat owners purchased at least one aftermarket accessory product in 2013, down from the 78 percent of boat owners who made such purchases in spent six percent more on operating costs in 2013 (fuel, repair/services, storage, insurance, taxes, and interest payments) than they did in 2012. Operating costs in 2013 totaled $ billion compared to $ billion in 2012.
10 Fuel accounted for more than three of 10 operating dollars; the increase was driven primarily by a four-day jump in the number of days spent BOATING . The average price of a gallon of gasoline during the primary BOATING season (May 1st through September 30th) was $ a gallon, one penny less than in owners used their boats on average 30 days during the year in 2013 four more days than the previous year. Owners of boats 30 feet and larger used their boats an average of 31 days; owners of boats smaller than 14 feet used their boats an average of 16 days and owners of boats 14 to 20 feet in length used their boats an average 24 days during the Boat Sales (Section 5)There were 532,170 new boats sold in 2013, a three percent decline compared to the previous year, corresponding retail value totaled $ billion an increase of 11 percent from 2012.