Transcription of A Practitioner’s Guide to Growth Models
1 A Practitioner s Guide to Growth ModelsKatherine E. CastellanoUniversity of California, BerkeleyAndrew D. HoHarvard Graduate School of EducationFebruary 2013A Practitioner s Guide to Growth ModelsAuthored By:Katherine E. Castellano, University of California, BerkeleyAndrew D. Ho, Harvard Graduate School of EducationA paper commissioned by theTechnical Issues in Large-Scale Assessment (TILSA)andAccountability Systems & Reporting (ASR)State Collaboratives on Assessment and Student StandardsCouncil of Chief State School Offi cersCopyright 2013 by the Council of Chief State School Offi rights Practitioner s Guide to Growth ModelsACKNOWLEDGEMENTSThis report has benefi tted from insightful comments and reviews from State Collaboratives on Assessment and Student Standards (SCASS) members, making it truly a product of collaboration. We extend special thanks to several assessment experts who volunteered their time and energy to improving various drafts.
2 Their insights as practitioners enhanced the utility of this report for its target audience. We thank Bill Bonk (Colorado Department of Education), Beth Cipoletti (West Virginia Department of Education), Juan D Brot (West Virginia Department of Education), Gary Phillips (American Institutes for Research), and Michelle Rosado (Connecticut State Department of Education) for their constructive reviews. Bill Auty (Education Measurement Consulting) provided assistance through the drafting process, and Frank Brockmann (Center Point Assessment Solutions, Inc.) provided design and production would also like to acknowledge the support of SCASS advisors Charlene Tucker, Duncan MacQuarrie, and Doug Rindone in providing feedback throughout the development of this report. Their vision for clear and accurate descriptions of Growth Models improved the content and the style of the document. Any remaining errors are A Practitioner s Guide to Growth ModelsTABLE OF CONTENTSPART I A FRAMEWORK FOR OPERATIONAL Growth Models .
3 91 Growth AND Growth Models .. 112 Growth : BEYOND STATUS .. 123 DIFFERENT WAYS TO SLICE THE DATA: STATUS, IMPROVEMENT, AND Growth .. The Vertical Slice: Across-Grade Status .. The Horizontal Slice: Improvement over Time .. The Diagonal Slice: Growth over Time .. 154 WHAT IS A Growth model ? .. 165 Growth Models OF INTEREST .. 176 CRITICAL QUESTIONS FOR DESCRIBING Growth Question 1: What Primary Interpretation does the Growth model Best Support? .. Question 2: What is the Statistical Foundation Underlying the Growth model ? .. Gain-based Models .. Conditional status Models .. Multivariate Models .. Question 3: What are the Required Data Features for this Growth model ? .. Vertical scales .. Profi ciency cut scores articulated across grades .. Multiple cut scores articulated across grades .. Large numbers of students .. Multiple years .. Meaningful controls/covariates .. Question 4: What Kinds of Group-Level Interpretations can this Growth model Support?
4 Question 5: How Does the Growth model Set Standards for Expected or Adequate Growth ? .. Question 6: What are the Common Misinterpretations of this Growth model and Possible Unintended Consequences of its Use in Accountability Systems? .. 277 ALTERNATIVE Growth model CLASSIFICATION SCHEMES .. 28 References (Part I) .. 29 List of Comparative Studies of Growth Models .. 305A Practitioner s Guide to Growth ModelsList of Reports Overviewing and Classifying Growth 31 Summary Table .. 32 PART II THE Growth Models ..33 CHAPTER 1 THE GAIN SCORE model .. Primary Interpretation .. Statistical Foundation .. Required Data Features .. Group-Level Interpretations .. Setting Standards for Expected or Adequate Growth .. Common Misinterpretations and Unintended 41 CHAPTER 2 THE TRAJECTORY model .. Primary Interpretation .. Statistical Foundation .. Required Data Features .. Group-Level Interpretations.
5 Setting Standards for Expected or Adequate Growth .. Common Misinterpretations and Unintended Consequences .. 53 CHAPTER 3 THE CATEGORICAL model .. Primary Interpretation .. Statistical Foundation .. Required Data Features .. Group-Level Interpretations .. Setting Standards for Expected or Adequate Growth .. Common Misinterpretations and Unintended Consequences .. 64 CHAPTER 4 THE RESIDUAL GAIN model .. Primary Interpretation .. Statistical Foundation .. Required Data Features .. 716 A Practitioner s Guide to Growth Group-Level Interpretations .. Setting Standards for Expected or Adequate Growth .. Common Misinterpretations and Unintended Consequences .. 76 CHAPTER 5 THE PROJECTION model .. Primary Interpretation .. Statistical Foundation .. Required Data Features .. Group-Level Interpretations .. Setting Standards for Expected or Adequate Growth .. Common Misinterpretations and Unintended Consequences.
6 87 CHAPTER 6 THE STUDENT Growth PERCENTILE model .. Primary Interpretation .. Statistical Foundation .. Required Data Features .. Group-Level Interpretations .. Setting Standards for Expected or Adequate Growth .. Common Misinterpretations and Unintended Consequences .. 100 CHAPTER 7 THE MULTIVARIATE model .. Primary Interpretation .. 1047. 2 Statistical Foundation .. 1057. 3 Required Data Features .. 1077. 4 Group-Level Interpretations .. 1077. 5 Setting Standards for Expected or Adequate Growth .. 1087. 6 Common Misinterpretations and Unintended Consequences .. 108 APPENDIX A CROSS-REFERENCING Growth model TERMS .. 111 BIBLIOGRAPHY .. 113 ABOUT THE AUTHORS .. 1177A Practitioner s Guide to Growth ModelsLIST OF TABLESPART ITable Example of a School Status Score .. 11 Table Example of School Status Scores across Grade Levels .. 12 Table Example of Within-Grade Improvement over Time.
7 13 Table Example of Growth ..14 Table Classifi cation Scheme for Growth Models .. 18 PART IITable Example of a Transition Matrix .. 56 Table Example of a Value Table .. 59 APPENDIX ATable Mapping Growth model Terminology from CCSSO s Understanding and Using Achievement Growth Data to those in this Practitioner s Guide .. 110 Table Mapping Growth model Terminology from the CCSSO Growth model Comparison Study to those in this Practitioner s Guide .. 1108 A Practitioner s Guide to Growth ModelsLIST OF FIGURESPART IFigure 1 Intuitive Depictions of Growth .. 9 PART IIFigure Illustration of the Gain Score model .. 35 Figure Different Distributions of Gain Scores with the Same Average Gain Score .. 37 Figure The Trajectory model Makes Predictions about Future Student Performance, Assuming that Gains Will Be the Same over Time .. 44 Figure Illustration of the Trajectory model at the Aggregate Level for Three Students (A, B, and C).
8 48 Figure Illustration of a Test Scale Divided into Ordered Performance Level Categories by Cut Scores .. 54 Figure Illustration of Possible Contradictions when Mapping a Vertical-Scale-Based Defi nition of Growth onto a Categorical Defi nition of Growth .. 57 Figure Illustration of the Residual Gain model .. 68 Figure Group-Level Interpretations from the Residual Gain model .. 72 Figure Illustration of the Residual Gain model : Regression of Grade 4 Scores on Grade 3 Scores .. 79 Figure The Projection model : using a Prediction Line Estimated from one Cohort to Predict Grade 4 Scores for another Cohort .. 80 Figure Illustration of a Simple Linear Regression Line (that Models the conditional average) and the Median Quantile Regression Line (that Models the conditional median).. 88 Figure Illustration of a Heuristic Approach to Computing Student Growth Percentiles.
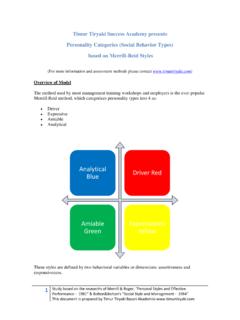
9 92 Figure An Illustration of Percentile Growth Trajectories .. 979A Practitioner s Guide to Growth ModelsPART I A FRAMEWORK FOR OPERATIONAL Growth MODELS10 A Practitioner s Guide to Growth Models11A Practitioner s Guide to Growth ModelsIf names are not correct, then language is not in accord with the truth of language is not in accord with the truth of things,then affairs cannot be carried out successfully. Confucius1 - Growth and Growth ModelsGrowth refers to an increase, expansion, or change over time. A common metaphor is that of a child growing in height or weight, where Growth is tracked easily as the change in inches and ounces over time. Asked to pantomime Growth , one might shrink into a crouch, mimicking a small child, and then jump up and out with arms and legs spread, emphasizing a two-stage, transformative process. Asked to draw Growth , one might draw a graph with an arrow starting in the lower left and pointing to the upper right.
10 Implicit in this graph is a vertical axis indicating a quantity of interest and a horizontal axis representing time. Figure shows two of these intuitive representations of 1 Intuitive Depictions of GrowthIf Growth Models for educational policy followed this commonsense intuition about Growth , there would be little need for this Guide . Instead, statistical Models and accountability systems have become increasingly varied and complex, resulting in Growth Models with interpretations that do not always align with intuition. This Guide does not promote one type of interpretation over another. Rather, it describes Growth Models in terms of the interpretations they best support and, in turn, the questions they are best designed to answer. The goal of this Guide is thus to increase alignment between user interpretations and model function in order for Models to best serve their desired purposes: increasing student achievement, decreasing achievement gaps, and improving the effectiveness of educators and schools.