Transcription of A Spectrum Analyzer for the Radio Amateur
1 By Wes Hayward, W7 ZOI, and Terry White, K7 TAU. A Spectrum Analyzer for the Radio Amateur Good tools are priceless when you need them. Here's a piece of test equipment you've always wanted for your workbench. Now you can have it without spending a fortune. mong the many measurement ments in the 50 kHz to 70 MHz region. The We often read and hear about simple A tools sought by the Amateur experimenter, the most de- sired but generally considered the least accessible is the Radio -frequency design can be extended easily into the VHF. and UHF region with methods outlined later. The instrument is configured to be self-calibrating, or capable of calibration designs.
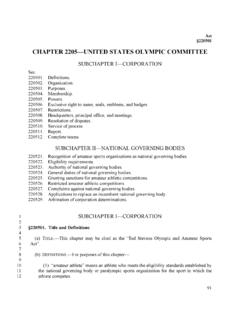
2 Simplicity implies that some- thing is eliminated to make the equipment easier to build, use or afford. Unlike de- signs that sacrifice performance for cost Spectrum Analyzer or SA. This need not be. with simple home-built test and simplicity, this one sacrifices only con- Simple and easily duplicated, this home- venience, while retaining the capabilities built Analyzer is capable of useful measure- 1. Notes appear on page 43. needed for accurate measurements. Figure 1 Block diagram of the Spectrum Analyzer . The circuit is a double-conversion superheterodyne design with intermediate frequencies of 110 and 10 MHz.
3 August 1998 35. Figure 2 Time base for the Spectrum Analyzer . Refer to the text for a discussion of the various circuit functions. Front-panel controls include SWEEP RATE, SPAN and TUNE. Unless otherwise specified, resistors are 1 / 4 W, 5% tolerance carbon-composition or film units. Equivalent parts can be substituted. U401, U402, U403 LM358 op amp R420, R423 PC-mount trim pots, 5 k or control, 5 k or 10 k suitable. If a 10. D403, D406 V Zener diodes, 1 W 10 k suitable turn pot is used for R3, R4 is not C401 Metal film or Mylar, F R3, R4, R5, R6 Panel-mounted linear needed. capacitor Modern technology eases the construc- function.
4 Hybrid and monolithic IC build- does not own an oscilloscope. With good tion of this Spectrum Analyzer . The loga- ing blocks are employed extensively. These basic 'scopes available for about the price rithmic amplifier uses an IF amplifier IC include mixers, amplifiers and VCOs all of a hand-held FM transceiver, every ex- found in cellular telephones and includes a vital elements in an Analyzer . Finally, it is perimenter should have one. Our Spectrum received signal strength indicator (RSSI) a rare devoted experimenter today who Analyzer uses a 'scope as the display. There 36 August 1998. are no special requirements for 'scope per- dow, while preserving system dynamic circuit commonly found in function gen- formance other than an X-Y mode with dc range.
5 The proper distribution of gain, se- erators. U401A operates as an integrator;. coupling in the X and Y axes. lectivity and signal-handling capability (in- current is pulled from the inverting input tercepts) of the amplifiers and mixers is through a 56-k resistor connected to the Some Spectrum -Analysis Basics vital to achieving good performance in a SWEEP RATE control. This current must The RF Spectrum Analyzer is essentially Spectrum Analyzer , and indeed, any re- flow through the capacitor (C401), creat- a swept receiver with a visual display. The ceiver. A proper design will have the same ing a linearly changing op-amp output volt- display shows the strength of all signals number of stages as a poor one, but will age.
6 This ramp is applied to U401B, a re- within a user-defined frequency span. Each probably use different components and generative comparator, which provides a signal is represented by a line or blip that consume more current. reset signal to the integrator. The sawtooth rises out of a background noise, much like The Analyzer uses a 15 V power supply. waveform (pin 1 of U401A) is asymmetri- the action of an S meter. Commercial ana- The positive supply delivers about A. cal: The positive-going ramp grows with a lyzers are calibrated for signal power, with The negative supply current drain is under slope determined by the front-panel- all signals referred to a reference level 50 mA.
7 Mounted SWEEP RATE pot, while the nega- at the top of the screen. Our Analyzer is Following sections present the circuit tive-going, faster reset ramp is determined designed for a basic reference level of blocks in greater detail, in the order that by fixed-value components. 30 dBm, a common value in commercial they should be built. The partial but grow- The U401 ramp is used twice. U402A and analyzers. 2 ing system can then be used to test the other B process the ramp to generate a signal that Signal levels are read from the display sections as they are built, turned on and drives the 'scope's X axis.
8 The signal has a by noting that power drops by 10 dB for integrated. We strongly discourage build- 0 V-centered range with just over a 10 V. each major division on the 'scope. You can ing the entire Analyzer before testing spe- total swing. Some of the square wave from change the reference level. Adding gain to cific sections. Such an approach may work the basic time base (U401B, pin 7) is added the Analyzer moves the reference to lower for casual kits, but is not suitable when to the input of U402B to cause the sweep to levels; introducing attenuation ahead careful control of signal levels is required.
9 Reset quickly, even though the return sweep of the instrument moves the reference to That approach also robs you (the builder) for the VCO occurs in a more stable, smooth higher power levels. of the excitement of the process: the learn- way. A slight overscan is generated for the X. ing that comes from detailed examination. axis, serving to hide an aberration occurring Circuit Overview Before jumping into the circuit details, near the sweep beginning. Figure 1 is a block diagram of our spec- we reemphasize that this Analyzer al- The sweep also generates the signal trum Analyzer . A double-conversion super- though simple is intended for serious that controls the VCO.
10 The sweep signal heterodyne, it begins with a step attenua- measurements. This means that a normal (U401A pin 1) is applied to a SPAN control. tor, followed by a low-pass filter and the maximum span display contains no spuri- When the Analyzer is set for maximum first mixer, where incoming signals are ous signals. When clean (well-filtered, har- span, the VCO voltage (about 2 to 10 V). upconverted to a 110 MHz first IF. After monic-free) signals are applied to the ana- generates a sweep from 110 to 180 MHz. some gain and band-pass filtering, a sec- lyzer, there should be no extra products as The VCO uses only positive sweep volt- ond conversion moves the signals to a long as the signal level is kept on screen.