Transcription of AB SCIEX Analysis of Polycyclic Aromatic Hydrocarbons (PAH …
1 P 1 Analysis of Polycyclic Aromatic Hydrocarbons (PAH), Alkylated Derivatives, and Photo-degradation Products in Environmental and Food Samples using LC-FLD-MS/MS with Q TRAP Technology Takeo Sakuma1, Daniel Leigh2, Carmai Seto1, Andr Schreiber1, and Rebecca Wittrig3 1AB SCIEX Concord, Ontario (Canada); 2AB SCIEX Warrington (UK); 3 Restek Corporation, Bellefonte, Pennsylvania (USA) Overview A new liquid chromatography (LC) method was developed that separates 26 Polycyclic Aromatic Hydrocarbons (PAH), 6 alkylated derivatives, and 11 photo-oxidation products in a single LC run followed by sensitive fluorescence detection (FLD) and tandem mass spectrometry (MS/MS). Hybrid triple quadrupole linear ion trap (4000 Q TRAP and QTRAP 5500 systems) were operated in highly selective Multiple Reaction Monitoring (MRM) with automatic acquisition of fast and sensitive enhanced product ion (EPI) scan to enable quantitation and compound identification in the same analytical run.
2 Three ionization modes, Electrospray (ESI), atmospheric pressure chemical ionization (APCI), and atmospheric pressure photo ionization (APPI) were examined. The developed method was applied to drinking water, atmospheric particulate, and seafood samples. Introduction There have been a number of maritime crude oil spills and explosions, like the 1989 Exxon Valdez accident in Prince William Sound Alaska releasing ~100 million gallons, the 2010 BP accident in the Gulf of Mexico releasing over 200 million gallons, and the 2011 Conoco-Phillips accident in North Eastern China, which contribute to the release of PAH and related compounds into the aquatic environment. PAH, their alkylated derivatives, and photo-oxidation products are priority pollutants because of their carcinogenic, mutagenic, and teratogenic properties. Hence, the presence of PAH in sea water is of great concern for the aquatic environment and for the fishing and seafood producing industry, as PAH are bioavailable to fish and seafood, and thus enter dietary sources.
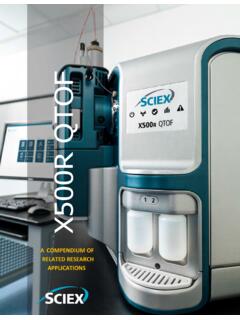
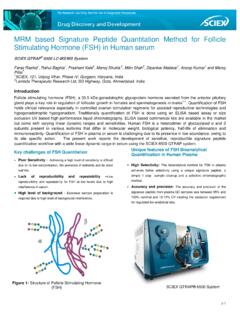
3 These PAH, alkylated derivatives and photo-oxidation products have a number of isomers and traditionally they are analyzed by GC or GC-MS. However, the analytical run time is significantly long, because these isomers have to be chromatographically separated. In addition, some of the polar photo-degradation products are not amenable to GC. In this study we investigated three LC-MS/MS ionization techniques and several small particle-size PAH LC columns to separate these isomers within a reasonable time and sensitivity. The resulting LC-FLD-MS/MS method was successfully applied to the Analysis of environmental and seafood samples. Experimental Chemicals A number of PAH, alkylated derivatives, and photo-oxidation products were obtained from Restek (Bellefonte, PA), Sigma-Aldrich Canada (Oakville, ON) and Ultra Scientific (N. Kingstown, RI). The structures of these standards are shown in Figure 1 and Table 1. p 2 Figure 1. Structures of targeted PAH, alkylated derivatives, and photo-degradation products (Compounds in bold are the 16 EPA priority PAH.)
4 OH2-naphtholbenzo(e)pyreneperylenenaphth aleneazuleneCH31-methylnaphthaleneCH32-m ethylnaphthaleneOO1,2-naphthoquinoneOO1, 4-naphthoquinoneanthracenephenanthreneOH 9-phenanthrolbiphenylacenaphtheneacenaph thyleneCH3CH32,6-dimethylnaphthalenefluo reneOH1-acenaphthenol9-fluorenoneO9-hydr oxyfluoreneOHSdibenzothiopheneCH3CH3CH32 ,3,5-trimethyl-naphthaleneCH31-methylphe nanthrenepyrenefluoranthenetriphenyleneb enzo(b)anthracenebenzo(b)fluorantheneben zo(j)fluoranthenebenzo(k)fluorantheneOH1 -naphthol1-hydroxypyreneOHchrysenebenzo( a)pyrenebenzo(a)anthraceneCH3CH37,12-dim ethylbenzo(a)anthraceneO9,10-dihydrobenz o(a)pyrene-7-oneindeno(1,2,3-cd)pyrenebe nzo(ghi)perylenedibenzo(a,h)anthracenepe ntacenecoronenerubrene p 3 Sample Preparation Seafood samples were prepared by Restek as per NOAA Technical Memorandum An atmospheric particulate sample was collected with a polyurethane disk sampler and extracted with a Soxhlet tube by Environment Canada, Ontario Region as per Environment Canada Protocol Some carcinogenic PAH s were incubated to form Phase I metabolites in rat liver microsomes for 1 hour at 37 C under oxidative conditions.
5 LC A Shimadzu NEXERA UHPLC system with a UV detector (SPD-20AV), a fluorescence detector (RF-20A XS) followed by MS/MS confirmation was used for Analysis . For drinking water Analysis a CTC PAL autosampler was used to enable large volume injection and extended wash cycles to reduce carry-over. Separation was achieved using an Inertsil ODS-P HP ( mm) 3 m column (GL Sciences, Tokyo, Japan), and a Kinetex C18 (50 x mm) m column with a mobile phase of water and acetonitrile. The column oven temperature was set to 20 C. A 30 minute multi-step gradient was required to separate critical isomers (Table 2). Table 1. MRM transitions used to detect PAH, alkylated derivatives, and photo-degradation products Analyte Q1 Q3 (quantifier) Q3 (qualifier) Analyte Q1 Q3 (quantifier) Q3 (qualifier) naphthalene 128 78 102 9-phenanthrol 194 151 166 azulene 128 78 102 fluoranthene 202 150 200 naphthalene-d8 136 84 108 pyrene 202 150 200 1-methylnaphthalene 142 89 115 1-hydroxypyrene 219 190 201 2-methylnaphthalene 142 115 141 chrysene 228 200 226 1-naphthol 145 63 122 triphenylene 228 200 226 2-naphthol 145 63 122 benzo(a)anthracene 228 150 226 acenaphthylene 152 126 151 benzo(b)anthracene 228 202 226 acenaphthene 154 126 153 chrysene-d12 240 208 236 biphenyl 154 126 153 benzo(b)fluoranthene 252 224 250 2,6-dimethylnaphthalene 156 115 141 benzo(j)fluoranthene 252 224 250 1,2-naphthoquinone 159 103 131 benzo(k)fluoranthene 252 224 250 1,4-naphthoquinone 159 103 131 benzo(a)pyrene 252 224 250 acenaphthene-d10 164 132 162 benzo(e)
6 Pyrene 252 222 250 fluorene 166 115 165 perylene 252 224 250 2,3,5-trimethylnaphthalene 170 128 153 7,12-dimethylbenzo(a)anthracene 257 226 242 1-acenaphthenol 171 46 72 perylene-d12 264 232 260 anthracene 178 152 176 9,10-dihydrobenzo(a)pyrene-7-one 271 215 253 phenanthrene 178 151 176 benzo(ghi)perylene 276 248 274 9-fluorenone 181 127 152 indeno(1,2,3-cd)pyrene 276 246 274 9-hydroxyfluorene 182 165 95 dibenzo(a,h)anthracene 278 248 276 dibenzothiophene 184 139 152 pentacene 278 250 276 phenanthrene-d10 188 158 184 coronene 300 296 298 1-methylphenathrene 192 165 191 rubrene 533 377 455 p 4 Table 2. LC gradient used for the separation of PAH, alkylated derivatives, and photo-degradation products Time (min) Flow ( L/min) A (%) B (%) 60 40 40 60 0 100 0 100 0 100 60 40 60 40 MS/MS MS/MS detection was performed on an AB SCIEX 4000 Q TRAP and QTRAP 5500 equipped with Turbo V source. ESI, APCI, and APPI techniques were investigated during method development.
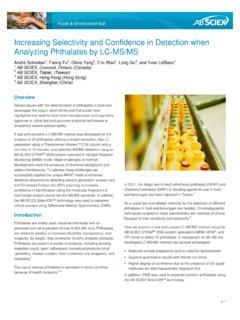
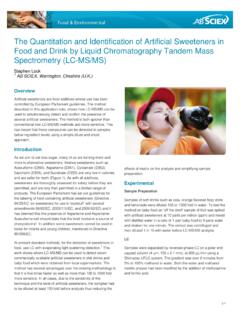
7 Selective and sensitive MRM mode was used for detection. Two transitions were monitored for each analyte to allow quantitation and identification using the ratio of quantifier and qualifier ion (Table 1). In addition, EPI spectra were acquired to use the molecular fingerprint saved into the MS/MS spectrum to increase the confidence of identification. Results and Discussion An example LC-FLD-MS/MS run is presented in Figure 2. The separation of critical isomers is highlighted in Figure 3. Figure 2: LC-MS/MS (top) and LC-FLD (bottom) Analysis of PAH, alkylated derivatives, and photo-degradation products Different detection and ionization techniques were investigated and compared regarding their selectivity, sensitivity, and linear dynamic range. Benzo(a)pyrene was used as a model compound for this study (Table 3). The UV detection at 254 nm suffered from high background and low specificity. FLD using optimized excitation wavelength and emission wavelength offered highest sensitivity, with a limit of detection (LOD) of ng/mL, but selectivity was limited in comparison to MS/MS detection.
8 ESI was found to give highest sensitivity of all ionization techniques, however, ESI showed strong matrix effects. APPI was investigated using different dopants, including toluene, anisol, and chlorobenzene. Chlorbenzene was found to give highest sensitivity for benzo(a)pyrene, however, background noise was increased and thus LOD was higher in comparison to ESI and APCI. Higher selectivity and sensitivity were achieved using APCI. In addition, APCI offers the advantage of increased robustness and minimal matrix effects. As a result APCI was chosen for further LC-MS/MS Analysis . The example calibration line presented in Figure 4 highlights the excellent linearity and reproducibility. LC-FLD and LC-MS/MS are complementary techniques for high sensitivity for quantitation with very little matrix interferences. While LODs of the quantitation of PAH are very similar using both techniques LC-MS/MS is able to ionize polar metabolites and degradation products more efficiently, thus, allowing quantitation at lower levels.
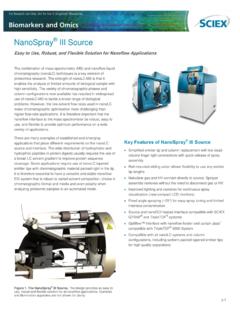
9 Table 3. Limits of detection (LOD) and linearity of different detection and ionization techniques of benzo(a)pyrene using the 4000 Q TRAP system using an injection volume of 10 L Detection by LOD (ng/mL) Linearity Additional comment UV 10 10 1000 high background FLD 1000 ESI 100 matrix effects APCI 1 1000 APPI 10 10 1000 high background XIC of +MRM (76 pairs): Da ID: naphthalene_78 from Sample 16 (fresh SCIEX PAH mix dil 100 pg_uL) of Cal RF-20 Axs ..Max. , , cpsShimadzu LC Controller Detector A, Channel 1 from Sample 16 (fresh SCIEX PAH mix dil 100 pg_uL) of Cal RF-20 Axs 5-um , Added ..Max.. , MRM transitionsFluorescence p 5 Figure 4. Calibration line of benzo(a)pyrene using triplicate injections into LC-MS/MS with APCI Examples of using the developed method for the Analysis of PAH, alkyl derivatives, and photo-oxidation products in a variety in environmental and food samples are presented in Figures 5 to 7.
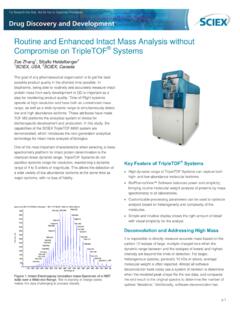
10 Figure 5. Analysis of an oyster extract using traditional MRM and the Scheduled MRM algorithm Figure 5 shows LC-MS/MS chromatograms of the Analysis of an oyster extract. The acquisition of traditional MRM mode is compared to an acquisition using the Scheduled MRM algorithm. Target analytes are monitored only in short time windows around the expected retention time using the Scheduled MRM algorithm. As a result the scheduling BaP5-ul (252 -224): "Linear" Regression ("1 / x" weighting): y = 100 x + (r = )050100150200250300350400450500550600650 7007508008509009501000 Concentration, , countsXIC of +MRM (76 pairs): Da ID: naphthalene_78 from Sample 38 (OYS 0-3 + 500 uL ACN) of Oyster NC=5 uA , , of +MRM (76 pairs): amu Expected RT: ID: naphthalene_78 from Sample 68 (OYS 0-3 + 500 uL ACN) of PAH , , MRMS cheduled MRMXIC of +MRM (76 pairs): Da ID: naphthalene_78 from Sample 38 (OYS 0-3 + 500 uL ACN) of Oyster NC=5 uA , , of +MRM (76 pairs): amu Expected RT: ID: naphthalene_78 from Sample 68 (OYS 0-3 + 500 uL ACN) of PAH , , MRMS cheduled MRMT raditional MRMS cheduled MRM algorithmFigure 3.