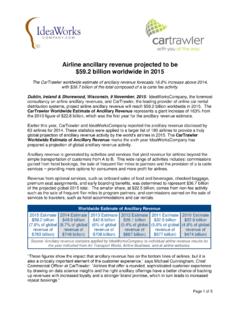
Transcription of Airline ancillary revenue projected to be $82.2 …
1 Airline ancillary revenue projected to be $ billion worldwide in 2017. The CarTrawler global estimate forecasts 22% increase above 2016, with $57 billion of the total composed of a la carte fee activity. Dublin, Ireland & Shorewood, Wisconsin, 28 November, 2017: IdeaWorksCompany, the foremost consultancy on Airline ancillary revenues, and CarTrawler, the leading provider of online car rental distribution systems, project Airline ancillary revenue will reach $ billion worldwide in 2017. The CarTrawler Worldwide Estimate of ancillary revenue represents a 264% increase from the 2010 figure of $ billion, which was the first annual ancillary revenue estimate. Earlier this year, CarTrawler and IdeaWorksCompany reported the ancillary revenue disclosed by 66 airlines for 2016. These statistics were applied to a larger list of 184 airlines to provide a truly global projection of ancillary revenue activity by the world's airlines for 2017.
2 The CarTrawler Worldwide Estimate of ancillary revenue marks the eighth year IdeaWorksCompany has prepared a projection of ancillary revenue activity. ancillary revenue is generated by activities and services that yield revenue for airlines beyond the simple transportation of customers from A to B. This wide range of activities includes commissions gained from hotel bookings, the sale of frequent flyer miles to partners, and the provision of a la carte services providing more options for consumers and more profit for airlines . CarTrawler Worldwide Estimate of ancillary revenue 2017 2016 2015 2014 2013 2012 2011 2010. Estimate Estimate Estimate Estimate Estimate Estimate Estimate Estimate $ billion $ billion $ billion $ billion $ billion $ billion $ billion $ billion ( of ( of ( of ( of ( of ( of ( of ( of global global global global global global global global revenue of revenue of revenue of revenue of revenue of revenue of revenue of revenue of $776 billion) $740 billion) $763 billion) $746 billion) $708 billion) $667 billion) $577 billion) $474 billion).
3 Source: ancillary revenue statistics applied by IdeaWorksCompany to annual Airline revenue results. Aileen McCormack, CarTrawler's Chief Commercial Officer said: It is terrific to see such healthy growth in worldwide Airline ancillary revenue , global online car rental grew by CAGR of for the period 2010 2016, is expected this year and a further in These figures indicate that ancillary profits are on a prolonged, upward trajectory and we are delighted to see more airlines looking further than traditional ancillary sources. CarTrawler's unrivalled industry experience, multimodal transport solutions and pioneering technological advances have allowed our partners to adequately develop their supplementary revenue streams, making us an invaluable asset to any Airline .. 1 Euromonitor International Limited 2017 All rights reserved. Page 1 of 5. Analysis performed by IdeaWorksCompany during the past seven years reveals natural Airline groupings (or categories) based upon a carrier's ability to generate ancillary revenue .
4 The percentage of revenue results associated with four defined categories have been applied to a worldwide compilation of operating revenue disclosed by 184 The following describes the four categories: Traditional airlines . This category represents a general category for the largest number of carriers. ancillary revenue activity may consist of fees associated with excess or heavy bags, extra legroom seating and partner activity for a frequent flyer program. The average percentage of revenue increased by nearly one percentage point to from for last year. Examples in this category include Cathay Pacific, Copa airlines , Etihad Airways, and Iberia airlines . Major US airlines . US-based majors generate strong ancillary revenue through a combination of frequent flyer revenue and baggage fees. The percentage of revenue for this group jumped to for 2017 from last year's and was likely due to an expansion of bundled fare offers and ever-growing frequent flyer revenue .
5 Examples in this category include Alaska, American, Hawaiian, and United. ancillary revenue Champs. These carriers generate the highest activity as a percentage of operating revenue . The percentage of revenue achieved by this group leapt to from for 2016. The size of the increase can be attributed to higher results from the big carriers in this category: Frontier, Ryanair, Spirit, and Wizz. Low Cost Carriers. LCCs throughout the world typically rely upon a mix of a la carte activity to generate good levels of ancillary revenue . The percentage of revenue for this group remained for a second year unchanged at for 2017. Low cost carriers include Brussels airlines , China United airlines , Condor, Interjet, and Jazeera Airways. CarTrawler Worldwide Estimate of ancillary revenue by Carrier Type for 2017. Total ancillary Frequent Flyer &. Airline Category A la Carte Activity revenue Commission Based Traditional airlines $ billion $ billion $ billion US Major airlines $ billion $ billion $ billion ancillary revenue $ billion $ billion $ billion Champs Low Cost Carriers $ billion $ billion $ billion Global Totals $ billion $ billion $ billion Source: ancillary revenue statistics applied by IdeaWorksCompany to 2016 Airline revenue results.
6 2 Operating revenue results were drawn from annual rankings in the June and July/August issues of Flight Airline Business. Additional sources were used, global alliance fact sheets and Airline websites, to complete the list of 184 airlines . Adjustments were made to prevent duplicate reporting associated with regional affiliates. Pure cargo carriers, such as FedEx and UPS airlines , were not included. airlines are assigned to specific categories each year based upon an assessment of a carrier's ancillary revenue profile. Page 2 of 5. Worldwide effort delivers an increase of nearly $15 billion for 2017. With few exceptions, airlines all over the world are moving to a la carte methods to provide more choices for consumers while boosting ancillary revenue . The pace of ancillary revenue activity quickens when major alliance members, such as Air France/KLM, American, Lufthansa, Qantas, and United embrace ancillary revenue methods.
7 The changes have a ripple effect through the oneworld, SkyTeam, and Star Alliances which encourages member airlines to adopt the same methods to smooth commercial and operational connections. This partially explains why the largest share of the 2017 increase came from the world's traditional airlines at $ billion, which was 41% of the total increase. For example, throughout North America, Europe, and Australasia, basic economy fares are now prevalent for short and medium haul travel. airlines using this a la carte approach usually find more than 50% of passengers select higher priced bundled options. When this activity is matched by an ever-growing pool of airlines , the result is billions more ancillary revenue . The graph below represents the likely distribution of ancillary revenue for traditional airlines outside the US. Admittedly, it's difficult to create a pie graph to display the wide variation for traditional airlines throughout the world, such as an Iberia in Europe or Singapore airlines in Asia.
8 In addition, the distribution of revenue sources is different for US airlines ; these have a far larger slice representing the sale of frequent flyer miles. Meanwhile, a depiction of revenue sources for almost any low cost carrier would notably display less revenue from a frequent Key ancillary revenue Components flyer program. Traditional airlines Outside the US. Onboard Services (Food, There are many other Seating, Duty reasons for 2017's big Free). revenue boost. airlines Baggage Fees 21%. 27%. labeled as ancillary revenue champs Sale of FFP. represented $ billion, or Miles 12%. 28%, of the 2017 increase. These airlines have built Other a la Carte Travel Retail Services (Hotel, Car, networks that now offer Insurance). attractive options for 25%. 15%. business travelers. Fare Distribution based upon analysis of 2016 results of non low cost carriers based outside the US. bundles that provide more flexibility, better seating, and fast track service at airports have been developed to lure commercial customers from traditional airlines .
9 In addition, frequent flyer program benefits are now a common feature for airlines in this category, such as those offered by AirAsia, Frontier, Jetstar, Norwegian, Pegasus, and Spirit. The following highlights specific activities recently taken by key ancillary revenue champs to attract more business travelers: AirAsia added a 24-hour business-style airport lounge at its Kuala Lumpur home to attract premium passengers. EasyJet achieved a 14% increase in flexible business fare sales during 2016. Jetstar introduced its Business Hub booking site and FlexiBiz bundle for corporate agents and business travelers. Ryanair is among the top tier of airlines for offering a total of 16 a la carte products to reach corporate travel agencies via Amadeus, Sabre, and Travelport. Page 3 of 5. Not to be forgotten, US major airlines contributed $ billion to the increase for 2017. The growing threat of low cost carriers has prompted these airlines to aggressively adopt a la carte methods.
10 Basic economy pricing, which does not include a checked bag, is now universally offered in the US. domestic market. American airlines has already said it's considering adding these fares to transatlantic markets, which will prompt others to consider the same. Frequent flyer programs in the US continue to generate ever increasing revenue for US major airlines as a result of renegotiated deals with issuing banks and the attraction consumers continue to show for co-branded cards. The ongoing push for better ancillary revenue performance from booking sites, mobile apps, and travel agency distribution networks will ensure even better results for US major airlines for 2018. ancillary revenue tops $20 per passenger for 2017. IATA predicts nearly billion passengers will spend $776 billion worldwide on air transport for Applying the global ancillary revenue estimate to IATA's statistic yields a result of $ per passenger.


