Transcription of Airport Operating Expenses - North America
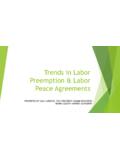
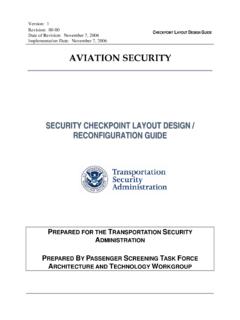
1 AirportInfo Airport Operating Expenses November 2014. Overview of Enplanements, Revenues and Expenses Percentage Change from Base Year 2001. Enplanements Revenues Expenses 80%. 70%. 60%. 50%. 40%. 30%. 20%. 10%. 0%. 2001 2002 2003 2004 2005 2006 2007 2008 2009 2010 2011 2012 2013. -10%. Operating Expenses and revenues have increased by 74% and respectively since 2001;. however, enplanements have only increased by driven by the economic slowdown and airline capacity cuts. Operating revenue has been increasing slightly faster than Expenses since 2010 as the industry recovers and airports continue to streamline their Expenses .
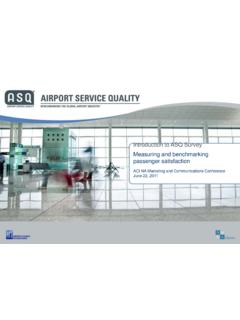
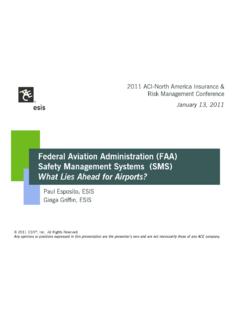
2 Source: FAA, CATS: Report 127 2. Airports Manage Revenue and Expenses Carefully to Ensure Adequate Funding for Capital Projects due to Decreasing Federal Funding 20 16%. 18 14%. 16 12%. In Billions of Dollars 14 10%. 8%. 12. 6%. 10. 4%. 8. 2%. 6 0%. 4 -2%. 2 -4%. 0 -6%. 2001 2002 2003 2004 2005 2006 2007 2008 2009 2010 2011 2012 2013. Operating Revenue Operating Expense Revenue Percentage Change from Previous Year Expense Percentage Change from Previous Year During the period of 2001-2013, total Operating revenue has been increasing primarily due to increases in non-aeronautical revenue.
3 Airports across all hub sizes are improving how they operate their businesses to better meet passenger needs. Total Airport Operating Expenses have been on the rise due to the regulatory burden imposed on airports to meet more stringent safety and security regulations noise abatement and safety management systems. Additionally, airports are also taking over functions that were traditionally performed by airlines. Source: FAA, CATS: Report 127 3. Functional Airport Operating Expenses Landside/Terminal Airfield Public Parking Operating Costs Airfield Operations and Maintenance Commercial Terminal Operating Aircraft Operations and Maintenance Costs Snow Removal and Ice Treatments Road Maintenance Mobile Lounges ( Dulles).
4 Transportation Costs (bus and rail Other(s). operations and maintenance). Elevator/Escalator/Moving Overall Airport Sidewalk System Maintenance Costs (Contractual and In-House) Utilities Costs Airport Operated Fixed Guide Way Labor Costs Rail/Monorail System Police, Security Guard Expenses , Firefighting Airport Operated Fixed Guide Way Costs ( Airport and Contracted). Bus System Environmental Shuttle Buses for Parking Vehicle Maintenance Costs Operations Marketing, Sales and Advertising Shuttle Buses between Terminals Grounds Maintenance Terminal Custodial Administrative (finance, HR, legal, executive, Other(s) procurement, etc.)
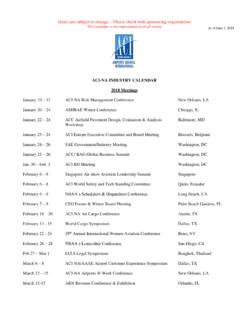
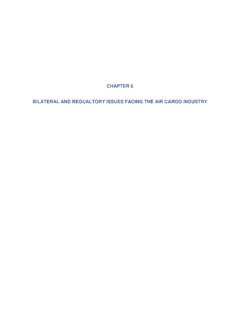
5 Other(s). Functional Operating Expenses Source: ACI 4. Airport 2013 Operating Expenses In Millions of Dollars Supplies and materials, $631, 6%. Insurance, claims and settlements, $251, 2%. Communications and utilities, Other, $1,084, $1,280, 9%. 11%. Total Operating Revenue, Total Operating $18,221, Expense, 61% $11,648, 39%. Contractual services, $3,843, Personnel 33% compensation and benefits, $4,559, 39%. Total Operating Expenses Note: Excludes depreciation. $11,648 Million 5. Source: FAA, CATS: Report 127. Airport Total Operating Expenses 2001 vs. 2013. Large Hub Medium Hub Small Hub Non-Hub In Millions of Dollars $847 $1,141 $2,035 $461.
6 $640. $1,267. 2013* - $11,647m $7,624. $4,326. 2001 - $6,694m 2001 2013*. Total Airport Operating Expenses has increased over 73 percent in the last 12 years due in large part to the excess of regulatory burdens. Operating Expenses do not include capital expenditure or construction projects, or other physical assets associated with the Airport . * 2013 Excludes Depreciation ($6,198m). Source: FAA, CATS: Report 127 6. Line item was added to the FAA Form 127 in 2009. Total Airport Operating Expenses 2001-2013. $14,000. $12,000 $847. ( ) $834. $809. $689 $756 $1,141. $10,000 $718.
7 In Millions o f Dollars $1,016. $630 $928 $894 $1,011. $1,047. $611 $876. $2,035. $550 $1,995. $8,000 $806 $2,047 $1,960 $1,916 $1,966. $521. $514 $763. $1,900. $495 $711 $739. $1,790. $461 $1,693. $679. $6,000 $640 $1,467 $1,528. $1,360. $1,267. $4,000 $7,333 $7,624. $6,939 $6,809 $6,828 $7,002. $6,438. $5,560 $5,880. $4,992 $5,117. $4,326 $4,616. $2,000. $0. 2001 2002 2003 2004 2005 2006 2007 2008 2009 2010 2011 2012 2013. Large Medium Small Non-Hub Note: Excludes depreciation. 7. Source: FAA, CATS: Report 127. Average Total Operating Expenses Per Enplanement $22. $20.
8 $18. $16. $14. $12. $10. 2007 2008 2009 2010 2011 2012 2013. Fiscal Year Large Medium Small Canadian All CAGR A true apples to apples comparison between 61 airports show that rising Airport Operating Expenses appear to be contributing to the upward trend in CPE. Despite high fixed Expenses , airports have continued to implement cost saving measures. Operating Expenses per enplanement is likely to rise in future years due to the need to upgrade aging infrastructure and accommodate increasing passenger travel. Source: ACI-NA 2014 Airport Performance Benchmarking Survey 8.
9 Airport Main Operating Expenses Personnel Compensation & Benefits CAGR. 2009 2010 2011 2012 2013 2009-2013. $4,284m $4,303m $4,373m $4,500m $4,557m Salaries and wages of personnel directly employed by the Airport including benefits such as health insurance, life insurance, and employee pensions. This expense category is subject to the Airport 's degree of outsourcing. Airports have been successful in keeping compensation and benefits cost under control, the growth rate of which has not kept up with the increase in Consumer Price Index (CPI). Communications & Utilities $1,057m $1,003m $1,031m $1,026m $1,084m Cost of communication services and utilities used in the course of Operating the Airport , including telephones, electricity, heating and air conditioning, and water.
10 Airports have implemented energy saving initiatives to reduce utility costs. Contractual Services $3,035m $3,276m $3,492m $3,598m $3,842m Contractual services are services performed by commercial enterprises and government agencies rather than by Airport employees. Such costs include consulting, legal, accounting, auditing, security, firefighting, engineering, training, lobbying, maintenance, janitorial services, architectural fees, and financial services. Airports have found increasing the degree of outsourcing successful in keeping compensation and benefits costs under control.