Transcription of Analyzing and Interpreting Large Datasets
1 PARTICIPANT WORKBOOK Measures of association analysistable shells Descriptive analysis univariable assess calculate testingvariables bivariable design justify confidence intervals software stratify plan confounding statistical Analyzing and Interpreting Large Datasets Created: 2013 Analyzing and Interpreting Large Datasets . Atlanta, GA: Centers for Disease Control and Prevention (CDC), AND Interpreting Large Datasets PARTICIPANT WORKBOOK |2 Table Of Contents INTRODUCTION .. 4 LEARNING OBJECTIVES .. 4 ESTIMATED COMPLETION TIME .. 4 TARGET AUDIENCE .. 4 PRE-WORK AND PREREQUISITES .. 4 ABOUT THIS WORKBOOK AND THE ACTIVITY WORKBOOK .. 4 ICON GLOSSARY .. 5 ACKNOWLEDGEMENTS .. 5 section 1: OVERVIEW .. 7 INTRODUCTION TO DATA ANALYSIS .. 7 STEPS IN Analyzing NCD DATA .. 7 KEY CONCEPTS .. 8 section 2: DESCRIPTIVE ANALYSIS .. 15 OVERVIEW OF DESCRIPTIVE ANALYSIS .. 15 UNIVARIABLE ANALYSIS .. 16 KEY POINTS TO REMEMBER .. 22 BIVARIABLE ANALYSIS.
2 26 section 3: ANALYTIC EPIDEMIOLOGY .. 36 OVERVIEW .. 36 CONCEPTS OF ASSOCIATION .. 36 KEY POINTS TO REMEMBER .. 40 STATISTICAL SIGNIFICANCE TESTING .. 43 CONFIDENCE INTERVALS .. 45 KEY POINTS TO REMEMBER .. 46 STRATIFIED ANALYSIS .. 47 EFFECT MEASURE MODIFICATION .. 48 CONFOUNDING .. 52 SUMMARY OF EMM AND CONFOUNDING .. 57 KEY POINTS TO REMEMBER .. 58 section 4: Interpreting AND REPORTING YOUR FINDINGS .. 63 RESOURCES .. 71 APPENDICES .. 72 APPENDIX A .. 73 Analyzing AND Interpreting Large Datasets PARTICIPANT WORKBOOK |3 APPENDIX B .. 75 Analyzing AND Interpreting Large Datasets PARTICIPANT WORKBOOK |4 Introduction LEARNING OBJECTIVES At the end of this module, you will be able to: conduct and interpret descriptive analysis and analytic epidemiology, summarize your findings, and prepare a COMPLETION TIME The workbook should take approximately 18 hours to complete. TARGET AUDIENCE The workbook is designed for FETP fellows who specialize in NCDs; however, you can also complete the module if you are working in infectious disease.
3 PRE-WORK AND PREREQUISITES Before participating in this training module, you must complete training in: Basic epidemiology and surveillance Basic analysis Statistical software program (your country is using) Creating an analysis plan Managing data (creating a data dictionary and cleaning data)ABOUT THIS WORKBOOK AND THE ACTIVITY WORKBOOK The format of the Participant Workbook consists of one overview section and three additional sections. You will read information about Analyzing and Interpreting Large Datasets and complete six exercises to practice the skills and knowledge learned. At the end of the training module, you will complete a skill assessment which combines all skills taught. Analyzing AND Interpreting Large Datasets PARTICIPANT WORKBOOK |5 ICON GLOSSARY The following icons will be used in this workbook: Image Type Image Meaning Activity Icon Pencil - an activity, exercise , assessment or case study that participants complete Stop Icon Stop - a point at which you should consult a mentor or wait for the facilitator for further locally relevant information about the topic Tip Icon Tip key idea to note and remember Resource Icon Resource / Website Icon- a resource or website that may provide further information on a given topic ACKNOWLEDGEMENTS Many thanks to the following colleagues from the Centers for Disease Control and Prevention for providing detailed feedback and guidance: Fleetwood Loustalot, PhD, FNP, Andrea Neiman, MPH, PhD(Division for Heart Disease and Stroke Prevention) and EdwardGregg, PhD (Division of Diabetes Translation), for creating thehypertension case study.
4 Lina Balluz, , MPH, from the Office of Surveillance,Epidemiology and Laboratory, Division of Behavioral SurveillanceANALYZING AND Interpreting Large Datasets PARTICIPANT WORKBOOK |6 Richard Dicker, MD, MS, from the Centers for Global Health, Divisionof Public Health Systems Workforce Development Italia Rolle, PhD, RD, Office on Smoking and Health, Global TobaccoControl Branch Roberto (Felipe) Lobelo, MD, PhD, Division of Diabetes TranslationANALYZING AND Interpreting Large Datasets PARTICIPANT WORKBOOK |7 section 1: Overview INTRODUCTION TO DATA ANALYSISIn the Creating an Analysis Plan module, you learned how to create table shells to use when you analyze data. The Managing Data module explained how to create a data dictionary to use during data analysis and how to clean the data. In this module, you will learn how to conduct descriptive analysis and analytic epidemiology and how to interpret the findings. If you look at the five W s of journalism below, descriptive and analytic epidemiology can help answer the following: What Who Where WhenClinical Person Place Time Descriptive Epidemiology (Distribution) Why/HowCause, mode of transmission, risk factors Analytic Epidemiology (Determinants) STEPS IN Analyzing NCD DATAWhen Analyzing data, you will begin with simple analysis (descriptive) and move to the complex.
5 As you recall, the main steps in Analyzing Large Datasets is as follows: Data into Action Analyzing and Interpreting Large Datasets Managing Data Creating an Analysis Plan Analyzing AND Interpreting Large Datasets PARTICIPANT WORKBOOK | basic descriptive analysis:Describe the sample population by person, place, and timecharacteristics. Summarize variables using population-level frequencies,and calculate stratified frequencies across important sub-groups (if any).The purpose of descriptive analysis is to characterize the study participants by age and sex distribution, where they are from, by distribution of risk factors, etc. You will calculate frequency-of-disease measures, such as prevalence. and interpret measures of association:Determine the strength of association between an exposure variable andan outcome variable. If there are two or more populations, considercomparing their demographic data to determine whether they weredifferent before the study/analysis was confidence intervals and/or statistical significance testing:Use t-tests for continuous data and chi-square for non-continuous for effect measure modifcation:A situation in which a third variable exhibiting statistical interaction byvirtue of its being antecedent in the causal process under the effect of potential confounders:A situation in which a measure of the effect of an exposure on risk isdistorted because of the association of exposure with other factors thatinfluencethe oucome under studyKEY CONCEPTSIn non-communicable diseases, we tend to use Large Datasets and conduct secondary data analysis.
6 The size of the database depends on the number of records (persons) and variables. Commonly used Datasets include: Vital registration (number of deaths, cause of death for a country) Demographic health surveys (DHS) used in low and middleincome countries WHO STEPS survey The National Health and Nutritional Examination survey ( ) Analyzing AND Interpreting Large Datasets PARTICIPANT WORKBOOK |9 The Behavioral Risk Factor Surveillance System (BRFSS - , Jordan)The databases typically are representative of a population either through a census (all persons included) or a sample (number of people selected to represent the population). For example, NHANES 1999-2000 interviewed 9,965 persons in the United States and the database includes hundreds of variables. Before attempting data analysis for Large Datasets , it is very important you locate the survey sampling methodology, questionnaire, data variable dictionary and any other supporting documentation.
7 Activity Activity #1: Go to the NHANES links below and describe what key information they provide. Write your response in the space below. Then check your response with Appendix A. 1. ;2. AND Interpreting Large Datasets PARTICIPANT WORKBOOK |10 Once you have your data, determine if the data include: All persons in the population of interest (census) A sample representative of the population ( probability simple random sample, random sample or cluster sampling) A sample not representative of the population ( non-probability convenience sampling or purposive sampling)Knowing this information will inform the statistics you will use during data analysis. Analyzing AND Interpreting Large Datasets PARTICIPANT WORKBOOK |11 Survey Commands For samples that are from complex survey designs, you must use the appropriate survey commands and not the regular commands in your statistical survey software. Before setting these commands, always look at the raw data before applying the survey commands using the non-survey commands.
8 This would be the first step before performing univariable analysis to view the data. In addition, for complex survey designs, you must set the weight command, strata, and psu (primary sampling unit) commands when computing representative estimates of the variables. After examining the data and finalizing your data analysis plan, proceed with using the survey commands to obtain estimates that account for the complex survey design and weighting. These estimates, although from a sample, are now representative of the population that was sampled. Population Parameters and Sample Statistics The following table is helpful when we talk about population parameters and sample statistics. The measures you use depend on the type of data you are Analyzing . Analyzing AND Interpreting Large Datasets PARTICIPANT WORKBOOK |12 Table 1: Population Parameters and Sample Statistics1 Population parameter Sample statistic N: Number of observations in the population n: Number of observations in the sample Ni: Number of observations in population i ni: Number of observations in sample i P: Proportion of successes in population p: Proportion of successes in sample Pi: Proportion of successes in population i pi: Proportion of successes in sample i : Population mean x: Sample estimate of population mean i: Mean of population i xi: Sample estimate of i : Population standard deviation s: Sample estimate of p: Standard deviation of p SEp: Standard error of p x: Standard deviation of x SEx: Standard error of x Let us examine standard error and standard deviation in more detail.
9 1 Taken from: Analyzing AND Interpreting Large Datasets PARTICIPANT WORKBOOK |13 Standard Deviation The standard deviation reflects the variability of the distribution of a continuous variable. To estimate the standard deviation: the weighted sum of the squares of the differences of theobservations in a simple random sample from the sample mean the result obtained in #1 by an estimate of the population size minus the square root of the result obtained in #2 Standard Error of the Mean The standard error of the mean is an indication of how well the mean of a sample estimates the mean of a population. To estimate the standard error, divide the estimated standard deviation by the square root of the sample size. Application of Weights In addition to population parameters and survey statistics, another important concept you need to know when using complex survey data is the use of weights. Use weights to account for complex survey design (including oversampling), survey non-response, and post-stratification.
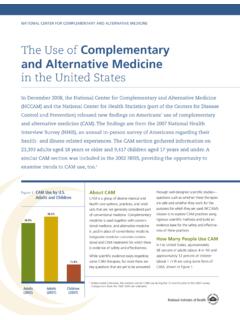
10 When a sample is weighted, it is representative of the population. A sample weight is assigned to each sample person. It is a measure of the number of people in the population represented by that sample person. Fortunately, there are several software packages for survey analysis that compute sampling errors correctly for weighted survey estimates from complex sample designs. It is important to use weighted data when you need to generalize the findings from your study to the whole population.. Weighting is a technique usually done by statistician to assure representation of cetain groups in the sample. It is a process that removes non-response and non -coverage bias. Resource For an example of standard error: Analyzing AND Interpreting Large Datasets PARTICIPANT WORKBOOK |14If you look at the graph below, you will see that the unweighted interview sample from NHANES 1999-2002 is composed of 47% non-Hispanic white and Other participants, 25% non-Hispanic Black participants, and 28% Mexican American participants.