Transcription of Appendix B: Tables - WebAssign
1 97626/11/16 10:36 AM
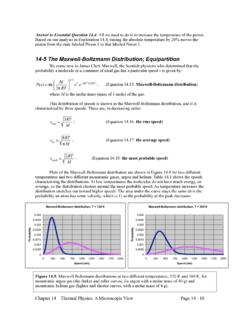
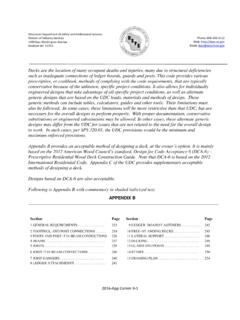
2 Appendix B: Tables TABLE 1 CumulATive ProBABiliTies for The sTAndArd normAl disTriBuTion Entries in the table give the area under the curve to the left of the z value.
3 For example, for z = .85, the cumulative probability is .1977. z 0 Cumulative probability z .00 .01 .02 .03 .04 .05 .06 .07 .08 .09 .0013 .0013 .0013 .0012 .0012 .0011 .0011 .0011 .0010 .0010 .0019 .0018 .0018 .0017 .0016 .0016 .0015 .0015 .0014 .0014 .0026 .0025 .0024 .0023 .0023 .0022 .0021 .0021 .0020 .0019 .0035 .0034 .0033 .0032 .0031 .0030 .0029 .0028 .0027 .0026 .0047 .0045 .0044 .0043 .0041 .0040 .0039 .0038 .0037 .0036 .0062 .0060 .0059 .0057 .0055 .0054 .0052 .0051 .0049 .0048 .0082 .0080 .0078 .0075 .0073 .0071 .0069 .0068 .0066 .0064 .0107 .0104 .0102 .0099 .0096 .0094 .0091 .0089 .0087 .0084 .0139 .0136 .0132 .0129 .0125 .0122 .0119 .0116 .0113 .0110 .0179 .0174 .0170 .0166 .0162 .0158 .0154 .0150 .0146 .0143 .0228 .0222 .0217 .0212 .0207 .0202 .0197 .0192 .0188 .0183 .0287 .0281 .0274 .0268 .0262 .0256 .0250 .0244 .0239 .0233 .0359 .0351 .0344 .0336 .0329 .0322 .0314 .0307 .0301 .0294.
4 0446 .0436 .0427 .0418 .0409 .0401 .0392 .0384 .0375 .0367 .0548 .0537 .0526 .0516 .0505 .0495 .0485 .0475 .0465 .0455 .0668 .0655 .0643 .0630 .0618 .0606 .0594 .0582 .0571 .0559 .0808 .0793 .0778 .0764 .0749 .0735 .0721 .0708 .0694 .0681 .0968 .0951 .0934 .0918 .0901 .0885 .0869 .0853 .0838 .0823 .1151 .1131 .1112 .1093 .1075 .1056 .1038 .1020 .1003 .0985 .1357 .1335 .1314 .1292 .1271 .1251 .1230 .1210 .1190 .1170 .1587 .1562 .1539 .1515 .1492 .1469 .1446 .1423 .1401 .1379 .9 .1841 .1814 .1788 .1762 .1736 .1711 .1685 .1660 .1635 .1611 .8 .2119 .2090 .2061 .2033 .2005 .1977 .1949 .1922 .1894 .1867 .7 .2420 .2389 .2358 .2327 .2296 .2266 .2236 .2206 .2177 .2148 .6 .2743 .2709 .2676 .2643 .2611 .2578 .2546 .2514 .2483 .2451 .5 .3085 .3050 .3015 .2981 .2946 .2912 .2877 .2843 .2810 .2776 .4 .3446 .3409 .3372 .3336 .3300 .3264 .3228 .3192 .3156 .3121 .3 .3821 .3783 .3745 .3707 .3669 .3632 .3594 .3557 .3520 .3483.
5 2 .4207 .4168 .4129 .4090 .4052 .4013 .3974 .3936 .3897 .3859 .1 .4602 .4562 .4522 .4483 .4443 .4404 .4364 .4325 .4286 .4247 .0 .5000 .4960 .4920 .4880 .4840 .4801 .4761 .4721 .4681 .4641 97726/11/16 10:36 AM
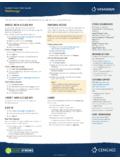
6 977 Appendix B Tables TABLE 1 CumulATive ProBABiliTies for The sTAndArd normAl disTriBuTion (Continued) Cumulative probability Entries in the table give the area under the curve to the left of the z value.
7 For example, for z = , the cumulative probability is .8944. 0 z z .00 .01 .02 .03 .04 .05 .06 .07 .08 .09 .0 .1 .2 .3 .4 .5000 .5398 .5793 .6179 .6554 .5040 .5438 .5832 .6217 .6591 .5080 .5478 .5871 .6255 .6628 .5120 .5517 .5910 .6293 .6664 .5160 .5557 .5948 .6331 .6700 .5199 .5596 .5987 .6368 .6736 .5239 .5636 .6026 .6406 .6772 .5279 .5675 .6064 .6443 .6808 .5319 .5714 .6103 .6480 .6844 .5359 .5753 .6141 .6517 .6879 .5 .6 .7 .8 .9 .6915 .7257 .7580 .7881 .8159 .6950 .7291 .7611 .7910 .8186 .6985 .7324 .7642 .7939 .8212 .7019 .7357 .7673 .7967 .8238 .7054 .7389 .7704 .7995 .8264 .7088 .7422 .7734 .8023 .8289 .7123 .7454 .7764 .8051 .8315 .7157 .7486 .7794 .8078 .8340 .7190 .7517 .7823 .8106 .8365 .7224 .7549 .7852 .8133 .8389 .8413 .8643 .8849 .9032 .9192 .8438 .8665 .8869 .9049 .9207 .8461 .8686 .8888 .9066 .9222 .8485 .8708 .8907 .9082 .9236 .8508 .8729 .8925 .9099 .9251 .8531 .8749 .8944 .9115 .9265 .8554 .8770 .8962 .9131.
8 9279 .8577 .8790 .8980 .9147 .9292 .8599 .8810 .8997 .9162 .9306 .8621 .8830 .9015 .9177 .9319 .9332 .9452 .9554 .9641 .9713 .9345 .9463 .9564 .9649 .9719 .9357 .9474 .9573 .9656 .9726 .9370 .9484 .9582 .9664 .9732 .9382 .9495 .9591 .9671 .9738 .9394 .9505 .9599 .9678 .9744 .9406 .9515 .9608 .9686 .9750 .9418 .9525 .9616 .9693 .9756 .9429 .9535 .9625 .9699 .9761 .9441 .9545 .9633 .9706 .9767 .9772 .9821 .9861 .9893 .9918 .9778 .9826 .9864 .9896 .9920 .9783 .9830 .9868 .9898 .9922 .9788 .9834 .9871 .9901 .9925 .9793 .9838 .9875 .9904 .9927 .9798 .9842 .9878 .9906 .9929 .9803 .9846 .9881 .9909 .9931 .9808 .9850 .9884 .9911 .9932 .9812 .9854 .9887 .9913 .9934 .9817 .9857 .9890 .9916 .9936 .9938 .9953 .9965 .9974 .9981 .9940 .9955 .9966 .9975 .9982 .9941 .9956 .9967 .9976 .9982 .9943 .9957 .9968 .9977 .9983 .9945 .9959 .9969 .9977 .9984 .9946 .9960 .9970 .9978 .9984 .9948 .9961 .9971 .9979 .9985 .9949 .9962 .9972.
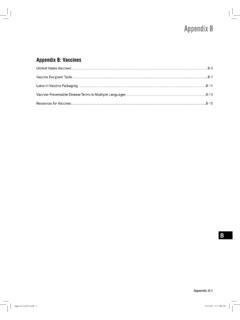
9 9979 .9985 .9951 .9963 .9973 .9980 .9986 .9952 .9964 .9974 .9981 .9986 .9987 .9987 .9987 .9988 .9988 .9989 .9989 .9989 .9990 .9990 97826/11/16 10:36 AMArea or probability 0 t entries in the table give t values for an area or probability in the upper tail of the t distribution. for example, with 10 degrees of freedom and a .05 area in the upper tail.
10