Transcription of Asset class returns - BlackRock
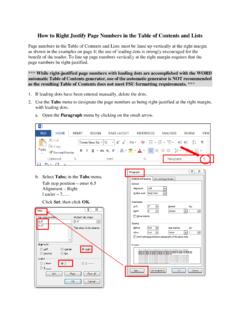
1 Source: Informa Investment Solutions. Past performance is no guarantee of future results. The information provided is for illustrative purposes and is not meant to represent the performance of any par ticular investment. Assumes reinvestment of all distributions. It is not possible to directly invest in an index. Diversification does not guarantee a profit or protect against diversified portfolio may reduce volatilityRanked annual total returns of key indexes (2002 2021) Asset class returnsWorst Best200220032004200520062007200820092010 2011201220132014201520162017201820192020 2021 Fixed income cap 47. 3%Int l l l cap growth income cap growth 37.
2 2 %Sm cap income 7. 8 %Lg cap value 17. 5%Sm cap cap core cap growth cap cap growth cap growth cap growth cap core l cap cap value 7. 1%Lg cap value l 2 . 1%Int l cap growth cap growth l 17. 3 %Lg cap growth cap value cap core cap value 17. 3 %Int l income cap core cap cap growth 27. 6 %Div portfolio cap value cap value portfolio cap income 7. 0 %Div portfolio cap 27. 2 %Lg cap value cap core 2 . 1%Sm cap cap value cap growth 13 . 1%Fixed income cap core cap core cap growth cap value cap core cap value cap value cap growth cap core cap growth cap core portfolio cap cap core cap core 15.
3 1%Div portfolio cap core cap core portfolio portfolio 0 . 1%Div portfolio portfolio cap core cap portfolio cap l cap core portfolio cap core portfolio cap core cap value portfolio portfolio cap value cap growth l income 0 . 1%Lg cap growth 7. 1%Sm cap portfolio l l 7. 8 %Div portfolio cap portfolio cap growth cap cap growth 9. 1%Cash cap core cap value l 7. 8 %Cash 0 . 1%Div portfolio portfolio cap l income cap value cap value portfolio income 7. 5%Int l cap core income 4.
4 1%Fixed income 3 . 1%Cash cap value cap growth income income cap income 0 . 1%Cash cap value l income cap income cap value 0 . 1%Lg cap growth income income cap l 0 . 1%Int l 0 . 1%Fixed income l cap l income is represented by the ICE BofA 3-month Treasury Bill Index, an unmanaged index based on the value of a 3-month Treasury Bill assumed to be purchased at the beginning of the month and rolled into another single issue at the end of the month. Treasury securities are direct obligations of the government and are backed by the full faith and credit of the government if held to maturity.
5 Diversified portfolio is composed of 35% of the Bloomberg Aggregate Bond Index, 10% of the MSCI EAFE Index, 10% of the Russell 2000 Index, of the Russell 1000 Growth Index and of the Russell 1000 Value Index. Fixed income is represented by the Bloomberg Aggregate Bond Index, an unmanaged market-weighted index that consists of investment grade corporate bonds (rated BBB or better), mortgages and Treasury and government agency issues with at least one year to maturity. International is represented by the Morgan Stanley Capital International (MSCI) EAFE Index, an unmanaged index that measures the total returns of developed foreign stock markets in Europe, Asia and the Far East.
6 Large cap core is represented by the S&P 500 Index, an unmanaged index that consists of the common stocks of 500 large capitalization companies, within various industrial sectors, most of which are listed on the New York Stock Exchange. Large cap growth is represented by the Russell 1000 Growth Index, which consists of those Russell 1000 Index securities with higher price-to-book ratios and higher forecasted growth rates. Large cap value is represented by the Russell 1000 Value Index, which consists of those Russell 1000 Index securities with lower price-to-book ratios and lower forecasted growth rates. small cap is represented by the Russell 2000 Index, which is a market-weighted small capitalization index composed of the smaller 2,0 0 0 stocks, ranked by market capitalization , of the Russell 30 0 0 : Informa Investment Solutions.
7 Past performance is no guarantee of future results. The information provided is for illustrative purposes and is not meant to represent the performance of any particular investment. Assumes reinvestment of all distributions. It is not possible to directly invest in an index. See front for index descriptions.* Standard deviations are calculated using monthly returns . Standard deviation is the measure of the total volatility, or risk in a portfolio. Standard deviation tells how widely a portfolio s returns have varied around the average over a period of time. 2022 BlackRock , Inc. All Rights Reserved.
8 BlackRock is a trademark of BlackRock , Inc. All other trademarks are those of their respective by BlackRock Investments, LLC, member FDIC Insured May Lose Value No Bank GuaranteeLit No. 20YR-SNAPSHOT-0122 220046T-0122 Diversification has provided more steady performanceGrowth of a hypothetical $100,000 investment over the last 20 years (2002-2021)500k$900k100k12/2112/1912/171 2/1512/1312/1112/0912/0712/0512/0312/01 Avg AnnReturns (%)StandardDeviation ( %)*Grew toAsset $598,454 small $495,521 Large Cap $462,408 Diversifi ed $617,143 Large Cap $786,575 Large Cap $233,606 Fixed $341, $129,145 CashUSRRMH0122U/S-1984712-2/2