Transcription of Barclays PLC
1 Barclays PLCQ3 2021 Results21 October 2021 Jes StaleyBarclays Group Chief Executive3| Barclays Q3 2021 Results | 21 October 2021 Record Q321 YTD profit before tax driven by strong CIB performance and net impairment release1 Period covering Q114 Q321. Pre 2014 financials not restated following re-segmentation in Q116| 2 Costs excluding structural cost actions and performance costs |Diversifiedstrategy delivering Record Group PBT of , RoTEof and EPS of aseconomies recover from pandemic driven lockdownsStrong CIB performance Best Q3 YTD Investment Banking fees and Equities income on a comparable basis1driving a CIB RoTE of recovery Strong UK mortgage and deposit volumes, positive trends in UK and US spending, well positioned for rising ratesInvesting for growth Reinvesting efficiency savings to drive income growth, while managing costs basecosts2expected to be broadly flat YoY at c. 12bnNet impairmentrelease Credit performance remains benign, with YTD impairment release ( in Q321)Capital above target CET1 ratioof , above the target range of 13-14%Income.
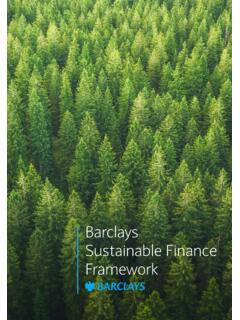
2 Income ratio 64%PBT | Barclays Q3 2021 Results | 21 October 2021 Diversified model underpins resilient performance through cycles1 Excludes negative income from Head Office | 2 Based on location of office where transactions recorded | Diversified by income typeDiversified by geographyDiversified by customer and client52% UK48% Non-UK32%11%5%52%UKAmericasEuropeOtherH1 21 Group income by geography243% Consumer57% WholesaleInvestment Banking feesGlobal MarketsCorporateInternational Consumer& PaymentsUK RetailBusiness Banking16%32%10%22%14%6%Q321 YTD Group income by customer135% NII65% Non NIINet interest Income (NII)Fees, commissionand other income65%35%Q321 YTDG roup incomeby type5| Barclays Q3 2021 Results | 21 October 2021 Environmental and Social stewardship central to our strategyContinuing to execute our climate strategy including net zero ambition Plan to extend BlueTrackTMto other sectors, beginning with Cement and Metals (aluminium and steel) At the centre of cross-industry initiatives for driving the transition to net zero-Net Zero Banking Alliance founding member under the Glasgow Financial Alliance for Net Zero -First sponsor and principal partner of the UK Government s Global Investment Summit-Member of the Financial Services Task Force (FSTF) and co-Chair of its Net Zero working group Expanding our sustainable finance offering through our specialist teams and integrating sustainability across our service offering.
3 Recent achievements include:-Helped the UK Government issue its 10bn green bond, the largest ever inaugural sovereign green bond-Lead manager on 7 out of 8 inaugural green bonds issued by European sovereigns since 2017-Launched a new sustainable investing opportunity through our Green Structured Notes programmeCommitted to promoting diversity and inclusion Appointed Group Chief Diversity Officer to lead our global D&I efforts Announced newly established ambitions to increase black and minority representation in our workforce Expanded our Female Innovators Lab, helping entrepreneurial women in the UK and Europe build venture-backablebusinesses, and increasing diversity in the FinTechsectorHelping our clients transition to a low-carbon economy6| Barclays Q3 2021 Results | 21 October 2021 Strong Q321 YTD profitability, increased capital distributions to shareholders1 Announced with H121 results and excludes the 700m buyback announced with FY20 results that was completed in H121 | 2 279m of the 500m share buyback announced at H121 results was completed as at 30-Sept-2021, with 316m completed as at COB 19-Oct-2021 |Q321 YTD metricsGroup targets over the medium termProgressive ordinary dividend, supplemented by additional cash returns, including share buybacks, as appropriateCapital distributionsCost: income ratio <60%Cost efficiencyCET1 ratio 13-14%Expect to remain above the target range at 31 December 2021 Capital adequacyGroup RoTE >10% Expect to deliver a RoTE above 10% in 2021 ReturnsGroup.
4 Income ratio 64%Cost efficiencyCET1 ratio adequacyTotal H121 payout equivalent of share12p half year dividend Announced 500m buyback with H121 results2 Capital distributionsTushar MorzariaBarclays Group Finance Director8| Barclays Q3 2021 Results | 21 October 2021Q321 YTD Group highlights Income of , in line with prior year, despite a 9% depreciation of average USD against GBP BUK income increased 2% YoY, CC&P income reduced 6% YoY, and CIB income reduced 1% compared to a strong prior year period Costs increased 6% YoY due to higher structural cost actions and performance costs Base costs were flat YoY incorporating investment for business growth, efficiency savings and favourable FX movements Net credit impairment release of Stage 1 and 2 impairment release of , primarily due to an improved macroeconomic outlook Stage 3 charge was reflecting reduced unsecured lending balances and benign credit performance PBT of , EPS of and RoTE of CET1 ratio of ,up 30bps from Dec-20 TNAV increased 18p from Dec-20 to 287p, reflecting of EPS, partially offset by net adverse reserve movements and other itemsTNAV287pDec-20: YTD: YTD: : income ratio64%Q320 YTD: 60%PBT YTD: CoverageRatio161%Dec-20: 162%Impairment ( )bn releaseQ320 YTD: YTD: YTD.
5 ,968247456492,4196,940Q320 YTDI ncomeCostsImpairmentOther net incomeQ321 YTDP rofit before tax ( m)9| Barclays Q3 2021 Results | 21 October 2021Q321 Group highlights Income of , up 5% YoY despite a 7% depreciation of average USD against GBP Improved income from BUK and CIB, partially offset by lower CC&P income Costs flat YoY reflecting efficiency savings and favourable FX movements, partially offset by higher structural cost actions and performance costs, and investment in business growth Impairment charge of ,reflecting an improved macroeconomic outlook, lower unsecured lending balances and a net wholesale release PBT of compared to in Q320 Attributable profit of generated EPS of and RoTEof CET1 ratio of ,up 30bps from Jun-21, reflecting profits, partially offset by the impact of the 500m share buyback announced with H121 results, dividend accrual and scheduled pension contributions TNAV increased 6p to 287p QoQ, primarilyreflecting of EPSTNAV287pJun-21: : : : income ratio64%Q320: 67%PBT : CoverageRatio161%Jun-21: 162%Impairment.
6 : ,1471,961Q320 IncomeCostsImpairmentOther net incomeQ321 Profit before tax ( m)10| Barclays Q3 2021 Results | 21 October 2021 BarclaysUK+6% YoY Improved mortgage marginsandincreased balances Non-recurrence of prior year COVID-19 customer support actions Partially offset by lower unsecured lending balancesBI: Consumer,Cards & Payments-8% YoY Lower average US cards balances and higher initial costs on new account acquisition Partially offset by higher Unified Payments and Private Bank incomeBI: Corporate& Investment Bank+8% YoY Global Markets-8% Equities +10% and FICC -20% Investment Banking fees +59% Advisory +181%, ECM +52% and DCM +34% Corporate-1% Transaction Banking +16% and Corporate Lending-28%Head OfficeGroup income +5% YoY ( m)Income: ongoing benefits from business diversification, with higher BUK and CIB income YoY more than offsetting lower CC&P income2,9052,6383,5942,9793,129876848805 8408081,5501,6261,5761,6231,638(127)(171 )(75)(27)(110)5,2044,9415,9005,4155,465Q 320Q420Q121Q221Q32111| Barclays Q3 2021 Results | 21 October unsecured lending remains subdued, mortgage balance growth continues and the Group is well positioned for rising rates1 Numbers do not tie to chart due to rounding | 2 See slide 34 for further details |Credit cardsMortgagesCC&P: US cards End Net Receivables ($bn)BUK: UK cards End Net Receivables ( bn)BUK.
7 Mortgage balances ( bn) Interest earning lending (IEL) growth is expected to lag the recovery in spending and total balance growth Expect income headwinds from higher acquisition costs as new accounts and balances grow, particularly in the US US cards end net receivables as at Sep-21 includes $ from the AARP portfolio acquisition Barclays is well positioned for a rising rate environment given significant deposit balances The scenario above assumes a 25bps parallel shift in interest rates, with the additional benefit in years 2 and 3, primarily reflecting the structural hedge being reinvested in higher yielding swaps of the Group income benefit from the illustrative 25bps upward parallel shift is in BUK, with the remaining in BI Given the move in the yield curve and increase in hedge notional, the structural hedge contribution in FY22 vs FY21 is no longer expected to be a headwindIllustrativeGroup income impact from a 25bps upward parallel shift in interest rate curves2( m) Year 1 Year 2 Year Strong mortgage flow from new applications, with net balances up in Q321 Q321 margins have reduced from the levels seen in H1215Y GBP SONIA swap rate (%)Group NII interest rate sensitivityGroup NII interest rate Moving Average12| Barclays Q3 2021 Results | 21 October 202136528510,06010,709Q320 YTDtotal costsBase costsPerformancecostsStructural costactionsQ321 YTDtotal costsCosts.
8 Q321 YTD increase driven by higher performance costs and structural cost actions, with flat base costsQ321 YTD total costs up 6% YoY ( m) Q321 total costs flat YoY reflecting efficiency savings and favourable FX movements, partially offset by higher structural cost actions and performance costs, and investment in business growth( m)Q321 total costs flat YoY ( m)1 Costs excluding structural cost actions and performance costs | Q321 YTD base costs, excluding structural cost actions and performance costs, were flat YoY Q321 YTD total costs increased 6% YoY driven by higher structural cost actions, higher performance costs that reflect improved returns, and continued investment in business growth, partly offset by FX movements and efficiency savings Q321 YTD performance costs increase of 365m booked largely in Q121 (+ 335m) Q321 structural cost actions of 71m, taking YTD structural cost actions to 392m92255803251141,7191,6011,8871,6241,7 495365415726075641,1201,1301,0391,0971,0 512993,4673,8263,5783,6533,478Q320Q420Q1 21Q221Q321 Head OfficeCIBCC&PBUKBank LevyQ3 YTD base costs flat YoY113| Barclays Q3 2021 Results | 21 October 2021 Evaluating planned structural cost actions for Q421Q321 YTD:392150368FY19FY20FY21 Q321 YTDstructural cost actions of 392m, including the 266mreal estate charge taken in Q221 to vacate a London office building by the end of 2022 Q221real estate charge expected to result in annual cost saving ofc.
9 50m from 2023 onwards Evaluating planned structural cost actions forQ421, including the continued transformationof the BUK cost base, as mentioned at Q221 Structural cost actions ( m)14| Barclays Q3 2021 Results | 21 October 2021FY20 to FY21 costs outlook ( m)Cost guidance unchanged, with FY21 base costs expected to be broadly in line with FY20 at c. 12bn1 Costs excluding structural cost actions and performance costs| 2 Bars not to scale | 3 Group cost outlook is based on an average rate of (USD/GBP) in H221 and subject to foreign currency movements |12, ,50436813,886FY20 Volume related growthInvestmentspendEfficiencysavingsFX / OtherFY21 Structural cost actionsPerformance costsBase costs1 Business demand-ledgrowth Inflationary pressures Strategic investments Technology and digital Cyber, fraud and regulatory controls Amortisationof capitalisedcosts Technology productivity Process optimisation Smart procurement Real estate strategy FX benefit (assumingaverage USD/GBP of in H221) LowerBank Levy Non-recurrence of Community Aid PackageKey drivers of base costs2 Base costs expected to be c.
10 12bn3as volume-related growth and investments are broadly offset by efficiencies and other tailwinds The economic recovery is presenting attractive opportunities, leading to a step-up in volume related growth and investment spend in FY21 Structural cost actions expected to be higher YoY Continuing to drive efficiencies and evaluating planned structural cost actions for Q421, including continued transformation of the BUK cost base Performance costs expected to be higher YoY reflecting improved Group returns15| Barclays Q3 2021 Results | 21 October 2021 Impairment: Q321 charge of 120m, reflecting lower unsecured lending balances and a net release in the CIBC omponents of impairment charge ( m)BUKI mpairment charge of 137m, down 41% YoY reflecting an improved macroeconomic outlook,and lower unsecured lending balances and delinquencies UK cards 30 and 90 day arrears rates were and respectively (Q221: and )BI: CC&PImpairment charge of 110m,down 40% YoY driven by lower US card delinquencies and highercustomer repayments US cards 30 and 90 day arrears rates were and respectively (Q221: and )BI.