Transcription of BASIC CALCULUS REFRESHER
1 1. BASIC CALCULUS REFRESHER . Ismor Fischer, Dept. of Statistics UW-Madison 1. Introduction. This is a very condensed and simplified version of BASIC CALCULUS , which is a prerequisite for many courses in Mathematics, Statistics, Engineering, Pharmacy, etc. It is not comprehensive, and absolutely not intended to be a substitute for a one-year freshman course in differential and integral CALCULUS . You are strongly encouraged to do the included Exercises to reinforce the ideas. Important mathematical terms are in boldface; key formulas and concepts are boxed and highlighted . To (). view a color .pdf version of this document (recommended), see ~ifischer. 2. Exponents BASIC Definitions and Properties For any real number base x, we define powers of x: x0 = 1, x1 = x, x2 = x x, x3 = x x x, etc.
2 (The exception is 00, which is considered indeterminate.) Powers are also called exponents. Examples: 50 = 1, ( )1 = , ( )2 = = , 103 = 10 10 10 = 1000, ( 3)4 = ( 3) ( 3) ( 3) ( 3) = 81. Also, we can define fractional exponents in terms of roots, such as x1/2 = x , the square root of x. 3. Similarly, x1/3 = x , the cube root of x, x2/3 = ( x). 3 2. , etc. In general, we have xm/n =. n ( x) m , , th th the n root of x, raised to the m power. 3 2. Examples: 641/2 = 64 = 8, 643/2 = ( 64) 3. = 83 = 512, 641/3 = 64 = 4, 642/3 = ( 3. 64 ) = 42 = 16. 1 1 1 1 1. Finally, we can define negative exponents: x r = . Thus, x 1 = 1 , x 2 = 2 , x 1/2. = = , etc. xr x x x1/2 x 1 1 1 1 1 1 1 1. Examples: 10 1 = 2. 1 = , 7 = 2 = , 36 1/2.
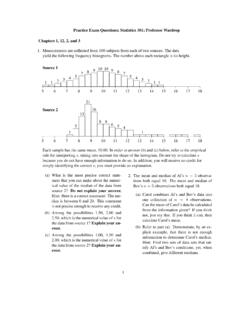
3 = = , 9 5/2. = = 5= . 10 7 49 36 6 5 3 243. ( 9). Properties of Exponents 1. xa xb = xa+b Examples: x3 x2 = x5, x1/2 x1/3 = x5/6, x3 x 1/2. = x5/2. xa x5 2 x 3. x3. 2. = xa b Examples: 2. 3=x , 5=x , = x5/2. xb x x x1/2. 3. (xa)b = xab Examples: (x3)2 = x6, (x 1/2 7. ) = x 7/2. , (x2/3)5/7 = x10/21. 2. 3. Functions and Their Graphs Input x f Output y If a quantity y always depends on another quantity x in such a way that every value of x corresponds to one and only one value of y, then we say that y is a function of x, written y = f (x); x is said to be the independent variable, y is the dependent variable. (Example: Distance traveled per hour (y). is a function of velocity (x). ) For a given function y = f(x), the set of all ordered pairs of (x, y)- values that algebraically satisfy its equation is called the graph of the function, and can be represented geometrically by a collection of points in the XY-plane.
4 (Recall that the XY-plane Descartes ~ 1640. consists of two perpendicular copies of the real number line a horizontal X-axis, and a vertical Y-axis that intersect at a reference point (0, 0) called the origin, and which partition the plane into four disjoint regions called quadrants. Every point P in the plane can be represented by the ordered pair (x, y), where the first value is the x-coordinate indicating its horizontal position relative to the origin and the second value is the y-coordinate indicating its vertical position relative to the origin. Thus, the point P(4, 7) is 4 units to right of, and 7 units up from, the origin.). Examples: y = f (x) = 7; y = f (x) = 2x + 3; y = f (x) = x2; y = f (x) = x1/2; y = f (x) = x 1; y = f (x) = 2x.
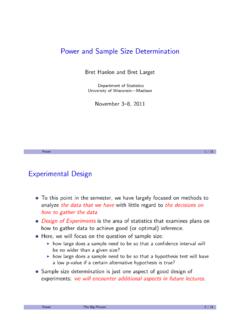
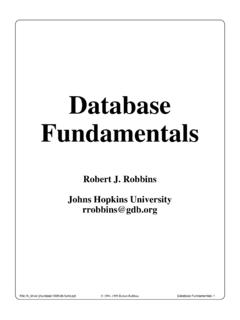
5 The first three are examples of polynomial functions. (In particular, the first is constant, the second is linear, the third is quadratic.) The last is an exponential function; note that x is an exponent! Let's consider these examples, one at a time. y = f (x) = 7: If x = any value, then y = 7. That is, no matter what value of x is chosen, the value of the height ( , 7) (0, 7) ( , 7). y remains at a constant level of 7. Therefore, all points that satisfy this equation must have the form (x, 7), and thus determine the graph of a horizontal line, 7 units up. A few typical points are plotted in the figure. Exercise: What would the graph of the equation y = 4. look like? x = 4 ? y = 0 ? x = 0 ? y = f (x) = 2x + 3: If x = 0, then y = f (0) = 2(0) + 3 = 3, so the point (0, 3) is on the graph of this function.
6 Likewise, if x = , then y = f ( ) = 2( ) + 3 =. 0, so the point ( , 0) is also on the graph of this function. (However, many points, such as (1, 1), do not (0, 3). satisfy the equation, and so do not lie on the graph.). The set of all points (x, y) that do satisfy this linear ( , 0). equation forms the graph of a line in the XY-plane, hence the name. Exercise: What would the graph of the line y = x look like? y = x ? The absolute value function y = |x| ? 3. Notice that the line has the generic equation y = f (x) = mx + b , where b is the Y-intercept (in this example, b = +3), and m is the slope of the line (in this example, m = +2). In general, the slope of any line is defined as the ratio of height change y to length change x, that is, y y2 y1.
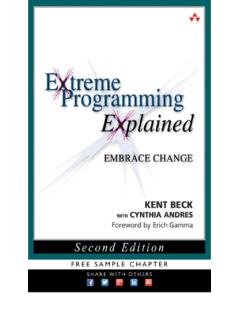
7 M = =. x x2 x1. for any two points (x1, y1) and (x2, y2) that lie on the line. For example, for the two points (0, 3) and y 0 3. ( , 0) on our line, the slope is m = = = 2, which confirms our observation. x 0. y = f (x) = x2: This is not the equation of a straight line (because of the squaring operation). The set of all points that satisfies this quadratic equation , ( 3, 9), ( 2, 4), ( 1, 1), (0, 0), (1, 1), (2, 4), (3, 9), etc.. forms a curved parabola in the XY-plane. (In this case, the curve is said to be concave up, , it holds water. Similarly, the graph of x2 is concave down;. it spills water. ). Exercise: How does this graph differ from y = f(x) =. x3 ? x4 ? Find a pattern for y = xn, for n = 1, 2, 3, 4, . y = f (x) = x1/2 = x : The square root operation is not defined for negative values of x ( , 64 does not exist as a real number, since both (+8)2 = +64 and y = x2.)
8 ( 8)2 = +64.) Hence the real-valued domain of this function is restricted to x 0 ( , positive values and zero), where the square root operation is defined ( , +64 = +8). Pictured here is its graph, along y= x with the first-quadrant portion of y = x2 for comparison. Exercise: How does this graph differ from y = f(x) =. 3 3. x1/3 = x ? Hint: What is its domain? ( , +64 = ??, 3. 64 = ???) Graph this function together with y = x3. The square operation x2 and square root operation x1/2 = x are examples of inverse functions of one another, for x 0. That is, the effect of applying of either one, followed immediately by the other, lands you back to where you started from. More precisely, starting with a domain value x, the composition of the function f(x) with its inverse written f 1(x) is equal to the initial value x itself.
9 As in the figure above, when graphed together, the two functions exhibit symmetry across the diagonal line y = x (not explicitly drawn). 4. 1. y = f (x) = x 1 = : This is a bit more delicate. Let's first restrict our attention to positive x 1. domain x-values, , x > 0. If x = 1, then y = f (1) = = 1, so the point (1, 1) lies on the graph of 1. this function. Now from here, as x grows larger ( , x = 10, 100, 1000, etc.), the values of the 1 1 1 1. height y = = = = etc. become smaller, although they x 10 100 1000. never actually reach 0. Therefore, as we continue to move to the right, the graph approaches the X-axis as a horizontal asymptote, without ever actually touching it. Moreover, as x gets smaller from the point (1, 1) on the graph ( , x = , , , etc.)
10 , the values of the height 1 1 1 1. y = = 10 = 100 = 1000 etc. become larger. Therefore, as we x continue to move to the left, the graph shoots upwards, approaching the Y-axis as a vertical asymptote, without ever actually touching it. (If x = 0, then y becomes infinite (+ ), which is undefined as a real number, so x = 0 is not in the domain of this function.) A similar situation exists for negative domain x-values, , x < 0. This is the graph of a hyperbola, which has two symmetric branches, one in the first quadrant and the other in the third. (1, 1). 1. Exercise: How does this graph differ from that of y = f (x) = x 2 = ? Why? x2. 5. NOTE: The preceding examples are special cases of power functions, which have the general form y = x p, for any real value of p, for x > 0.