Transcription of Beginner's guide to using the DESeq2 package - VEuPathDB
1 beginner s guide to using the DESeq2 packageMichael Love1 , Simon Anders2, Wolfgang Huber21 Department of Biostatistics, Dana Farber Cancer Institute andHarvard School of Public Health, Boston, US;2 European Molecular Biology Laboratory (EMBL), Heidelberg, Germany michaelisaiahlove (at) 13, 2014 AbstractThis vignette describes the statistical analysis of count matrices for systematic changes be-tween conditions using theDESeq2package, and includes recommendations for producing countmatrices from raw sequencing data. This vignette is designed for users who are perhaps newto analyzing RNA-Seq or high-throughput sequencing data in R, and so goes at a slower pace,explaining each step in detail. Another vignette, Differential analysis of count data the DESeq2package covers more of the advanced details at a faster you useDESeq2in published research, please cite:M.
2 I. Love, W. Huber, S. Anders: Moderated estimation offold change and dispersion for RNA-Seq data with (2014). [1]1 beginner s guide to using the DESeq2 package2 Contents1 Introduction22 Input count matrices.. reads to a reference .. reads in genes .. data .. DESeqDataSet, column metadata, and the design formula.. from SummarizedExperiment .. from count tables .. technical replicates .. 123 Running the DESeq2 the data object for the analysis of interest .. the pipeline .. the results table.. comparisons .. testing.. plots .. 194 Independent gene names.. results .. 255 Working with rlog-transformed rlog transform .. distances .. clustering .. 306 Session Info311 IntroductionIn this vignette, you will learn how to produce a read count table such as arising from a summarizedRNA-Seq experiment analyze count tables for differentially expressed genes, visualize the results, addextra gene annotations, and cluster samples and genes using transformed dataBeginner s guide to using the DESeq2 count matricesAs input, theDESeq2package expects count data as obtained, e.
3 G., from RNA-Seq or another high-throughput sequencing experiment, in the form of a matrix of integer values. The value in thei-throw and thej-th column of the matrix tells how many reads have been mapped to geneiin , for other types of assays, the rows of the matrix might correspond e. g. to binding regions(with ChIP-Seq) or peptide sequences (with quantitative mass spectrometry).The count values must be raw counts of sequencing reads. This is important forDESeq2 s statisticalmodel to hold, as only the actual counts allow assessing the measurement precision correctly. Hence,please do not supply other quantities, such as (rounded) normalized counts, or counts of covered basepairs this will only lead to nonsensical reads to a referenceThe computational analysis of an RNA-Seq experiment begins earlier however, with a set of FASTQ files, which contain the bases for each read and their quality scores.
4 These reads must first be alignedto a reference genome or transcriptome. It is important to know if the sequencing experiment wassingle-end or paired-end, as the alignment software will require the user specify both FASTQ files for apaired-end number of software programs exist to align reads to the reference genome, and the development istoo rapid for this document to provide a current list. We recommend reading benchmarking paperswhich discuss the advantages and disadvantages of each software, which include accuracy, ability toalign reads over splice junctions, speed, memory footprint, and many other have experience using the TopHat2 spliced alignment software1[2] in combination with the Bowtieindex available at the Illumina iGenomes page2. For full details on this software and on the iGenomes,users should follow the links to the manual and information provided in the links in the footnotes.
5 Forexample, the paired-end RNA-Seq reads for theparathyroidSEpackage were aligned using TopHat2with 8 threads, with the call:tophat2 -o file_tophat_out -p 8 genome sort -n file_tophat_ _sortedThe second line sorts the reads by name rather than by genomic position, which is necessary for countingpaired-end reads within Bioconductor. This command uses the SAMtools software3[3]. The BAM filesfor a number of sequencing runs can then be used to generate coun matrices, as described in thefollowing s guide to using the DESeq2 reads in genesOnce the reads have been aligned, there are a number of tools which can be used to count the numberof reads which can be unambiguously assigned to genomic features for each sample. These often takeas input BAM or SAM alignment files and a file specifiying the genomic features, GFF3 or GTFfiles specifying a gene following tools can be used generate count tables:functionpackageoutputDESeq2input functionsummarizeOverlapsGenomicAlignmen ts(Bioc)SummarizedExperimentDESeqDataSet htseq-count[4]HTSeq (Python)count filesDESeqDataSetFromHTSeqfeatureCounts[ 5]Rsubread(Bioc)count matrixDESeqDataSetFromMatrixsimpleRNASeq [6]easyRNASeq(Bioc)SummarizedExperimentD ESeqDataSetIn order to produce correct counts, it is important to know if the experiment was strand-specific or example,summarizeOverlapshas the , which should be set toTRUEif the experiment was not strand-specific andFALSEif the experiment was strand-specific.
6 Similarly,htseq-counthas the argument--stranded yes/no/reverse, where strand-specific experimentsshould use--stranded yesand wherereverseindicates that the positive strand reads should becounted to negative strand following example usessummarizeOverlapsfor read counting, while produces aSummarizedEx-perimentobject. This class of object contains a variety of information about an experiment, and will bedescribed in more detail below. We will demonstrate using example BAM files from theparathyroidSEdata package . First, we read in the gene model from a GTF file, themakeTranscriptDbFromBiomartfunction can be used to automatically pull a genemodel from Biomart. However, keeping the GTF file on hand has the advantage of bioinformatic re-producibility: the same gene model can be made again, while past versions of gene models might notalways be available on Biomart.
7 These GTF files can be downloaded from Ensembl s FTP site or othergene model repositories. The third line here produces aGRangesListof all the exons grouped by ( "GenomicFeatures" )hse <- makeTranscriptDbFromGFF( "/path/to/ ", format="gtf" )exonsByGene <- exonsBy( hse, by="gene" )We specify the BAM files which will be used for <- ( "/path/to/bam/files", pattern="bam$", full=TRUE )We indicate in Bioconductor that these fls are BAM files using theBamFileListfunction. Here wealso specify details about how the BAM files should be treated, , only process100000reads at ( "Rsamtools" )bamLst <- BamFileList( fls, yieldSize=100000 )We callsummarizeOverlapsto count the reads. We use the counting mode"Union"which indi-cates that reads which overlap any portion of exactly one feature are counted.
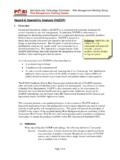
8 For more ihnforma- beginner s guide to using the DESeq2 package5assay(s) 'counts'rowDatacolDataFigure 1:Diagram of SummarizedExperimentHere we show the component parts of aSumma-rizedExperimentobject, and also its subclasses, such as theDESeqDataSetwhich is explained in thenext section. Theassay(s)(red block) contains the matrix (or matrices) of summarized values, therowData(blue block) contains information about the genomic ranges, and thecolData(purple block)contains information about the samples or experiments. The highlighted line in each block representsthe first row (note that the first row ofcolDatalines up with the first column of on the various counting modes, see the help page forsummarizeOverlaps. As this experimentwas a paired-end, we specifysingleEnd=FALSE.)
9 As it was not a strand-specific protocol, we that we also want to count reads with unmappedpairs. This last argument is only for use with paired-end ( "GenomicAlignments" )se <- summarizeOverlaps( exonsByGene, bamLst,mode="Union",singleEnd=FALSE, ,fragments=TRUE )This example code above actually only counts a small subset of reads from the original experiment: for3 samples and for 100 genes. Nevertheless, we can still investigate the resultingSummarizedExperimentby looking at the counts in theassayslot, the phenotypic data about the samples incolDataslot (inthis case an emptyDataFrame), and the data about the genes in s guide to using the DESeq2 package6se## class: SummarizedExperiment## dim: 100 3## exptData(0):## assays(1): counts## rownames(100): ENSG00000000003 ENSG00000000005 .. ENSG00000005469## ENSG00000005471## rowData metadata column names(0):## colnames(3): ## colData names(0):head( assay(se) )## ## ENSG00000000003 0 0 1## ENSG00000000005 0 0 0## ENSG00000000419 0 0 0## ENSG00000000457 0 1 0## ENSG00000000460 0 0 0## ENSG00000000938 0 0 0colSums( assay(se) )## ## 31 21 27colData(se)## DataFrame with 3 rows and 0 columnsrowData(se)## GRangesList of length 100:## $ENSG00000000003## GRanges with 17 ranges and 2 metadata columns.
10 ## seqnames ranges strand | exon_id exon_name## <Rle> <IRanges> <Rle> | <integer> <character>## [1] X [99883667, 99884983] - | 664095 ENSE00001459322## [2] X [99885756, 99885863] - | 664096 ENSE00000868868## [3] X [99887482, 99887565] - | 664097 ENSE00000401072## [4] X [99887538, 99887565] - | 664098 ENSE00001849132## [5] X [99888402, 99888536] - | 664099 ENSE00003554016## ..## [13] X [99890555, 99890743] - | 664106 ENSE00003512331## [14] X [99891188, 99891686] - | 664108 ENSE00001886883## [15] X [99891605, 99891803] - | 664109 ENSE00001855382## [16] X [99891790, 99892101] - | 664110 ENSE00001863395## [17] X [99894942, 99894988] - | 664111 ENSE00001828996 beginner s guide to using the DESeq2 package7####.