Transcription of BROILER INDUSTRY STATS SUMMARY FOR 2017
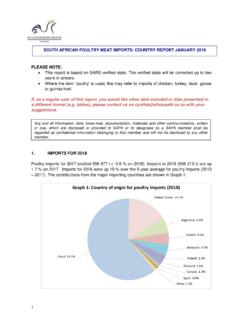
1 1 | P a g e BROILER INDUSTRY STATS SUMMARY FOR 2017 INDUSTRY STATISTICS 1. Price comparison of protein sources In 2017 the weighted average producer price for total BROILER sales realisation (less all discounts, rebates and secondary distribution) was Eggs were marginally cheaper at The average beef abattoir selling prices for classes A2/A3 and C2/C3 were and respectively. The average abattoir price for pork (all classes) was The producer prices and the annual percentage increases are shown in Figure 1. Figure 1: Comparison of the producer prices of different protein sources 2. International price competitiveness The United States Department of Agriculture (USDA) figures show that the average price in the northeast region of the USA for leg quarters was and for skinless, deboned breast Compared to 2016, the prices have increased by and respectively.
2 Using the average exchange rate of to the US dollar for the year 2017, the leg quarter price equates to 2 | P a g e and the skinless, deboned breast price to The South African price for mixed individually quick-frozen portions was and for fresh and frozen filleted breast and respectively. Figure 2 shows the trend in these prices since 2013 and helps to explain why the USA is keen to dump the bone-in darker meat portions in South Africa, although the gap is narrowing. The price of the deboned breasts has declined at a slightly steeper rate than leg quarters over the past four years. Average prices (c/lb) for the various portions are given in Table 2. Figure 2: Chicken prices in the USA (source: USDA) TABLE 2: USDA portion prices (c/lb) Portion 2016 2017 % change Whole BROILER Breasts, deboned and skinless Tenderloins Breast with ribs Breast (line run) Legs Leg quarters Drumsticks Thighs Thighs, deboned and skinless Wings 3.
3 Volume and growth Two methods are used to predict BROILER production volumes and growth: 3 | P a g e Model 1: The BROILER forecasting model uses the number of day-old female parent placements supplied by the INDUSTRY to predict the size of the breeder flocks, the number of day-old BROILER chicks hatched and the number of broilers slaughtered; Model 2: A simpler model uses the number of day-old BROILER chicks hatched supplied by the INDUSTRY to predict the number of broilers slaughtered. Both models are reliant on accurate and regular statistics being submitted by the INDUSTRY . 4. BROILER breeders The average number of parent males and females in rearing during 2017 was million per week; a decrease of 343 000 birds ( ) compared to 2016. Using a genetic pyramid, the estimated number of grandparent and great-grandparent stock (males and females) in South Africa was 244 000.
4 An average BROILER breeder laying flock of million hens was estimated for 2017; a decrease of 605 000 hens ( ) compared to 2016. Figure 3 shows the changes in the size of the BROILER breeder laying flock since 2013. Figure 4 illustrates the total number of day-old BROILER chicks hatched annually. In 2017 a total of million day-old chicks were hatched; a annual decrease. Figure 3: The size of the BROILER breeder flock 4 | P a g e Figure 4: Annual day-old chick production 5. BROILER production A total of million broilers were slaughtered in 2017; a decrease of million ( ) compared to the previous year. Bird numbers are summarised in Table 3. TABLE 3: Bird numbers for the BROILER INDUSTRY (millions) Year BROILER breeders Breeders BROILER chicks hatched broilers broilers slaughtered Rearing Laying Per week Per week Per annum Per week Per week Per annum 2016 2017 Change % change 6.
5 Prospects for 2018 Based on the number of day-old parent pullets placed to December 2017, the size of the breeder laying flock is expected to decrease by to million during the first 4 months of 2018. The forecasting model predicts a potential hatch to June 2018 of million chicks per week and a potential production of broilers to July 2018 of million per week. 7. Input costs The average BROILER feed price for 2017 was R5 The BROILER feed price includes distribution, but excludes medication, additives and VAT. The movement in the feed price over a five-year period is shown in Figure 5. 5 | P a g e Figure 5: BROILER feed price The year-on-year percentage changes in the BROILER feed price and the producer price are shown in Figure 6. In 2017 the average feed price decreased by while the producer price increased by This is in stark contrast with 2016, when feed prices increased by and producer prices increased by only Figure 6: Yearly percentage changes in producer price and feed price 8.
6 Feed usage The feed usage for BROILER breeders and broilers is summarised in Table 4. 6 | P a g e TABLE 4: Feed usage for the BROILER INDUSTRY (tonnes) Year BROILER breeders Total breeding stock broilers Total BROILER INDUSTRY Rearing Laying Per annum Per week Per annum Per week Per annum Per week 2016 99 429 441 644 541 073 10 348 2 795 675 53 469 3 336 748 63 818 2017 90 332 403 032 493 363 9 462 2 781 908 53 352 3 275 271 62 813 Change -9 098 -38 612 -47 710 -887 -13 767 -118 -61 477 -1 004 % change According to the Animal Feed Manufacturers Association (AFMA), national feed sales from 1 April 2016 to 31 March 2017 for breeders and broilers amounted to million tonnes; a year-on-year decrease. These figures exclude non-members of AFMA. For the same period, SAPA estimated feed consumption at million tonnes; 183 600 tonnes (+ ) more than actual feed sales.
7 9. Meat production Total production of poultry meat (all saleable products) for 2017 was million tonnes. This was made up of million tonnes ( ) from commercial production, an estimated 63 994 tonnes ( ) from subsistence farming, and 963 tonnes ( ) from ducks. Chicken production therefore amounted to million tonnes (source: SAPA). Commercial production (including offal) can be further broken down into: BROILER meat (all saleable products): million tonnes; Cull BROILER breeder males and females: 33 900 tonnes; Cull layer hens: 35 600 tonnes. DAFF estimated the total production of poultry meat at million tonnes, up from 2016. DAFF s estimate is larger than SAPA s production estimate. 10. Consumption DAFF s estimates of poultry consumption for 2017 amounted to million tonnes; an annual increase of The per capita consumption of poultry meat was kg, compared to kg ( ) in 2016.
8 Due to SAPA not submitting statistics timeously, DAFF based its calculations on its own estimates of production data. DAFF also uses trade statistics from a source other than the South African Revenue Service (SARS). According to SAPA s calculations, poultry consumption amounted to million tonnes. The per capita consumption of poultry meat for 2017 was kg, compared to kg ( ) in 2016. This includes the sale of spent hens from the BROILER breeder and commercial layer industries, the sale of all the edible offal, imports, as well as other poultry species. DAFF s estimate of poultry meat consumption is larger than SAPA s estimate. 7 | P a g e Consumption of BROILER (chicken) meat (all saleable products) amounted to million tonnes in 2017; a annual decrease. The per capita consumption of chicken meat for the year was kg, compared to kg in 2016; a decrease (source: SAPA).
9 Poultry imports made up 26% of poultry meat consumption; the same as in 2016. 11. Gross value The gross value of primary agricultural production from poultry meat (inclusive of all types of poultry) for the period 2017 was billion, reflecting an annual increase of (source: DAFF). Poultry meat contributed to the gross value of animal products (up from in 2016) and to all agricultural production (up from in 2016). The gross value for 2017 was calculated by DAFF based on its own estimations of poultry meat production, in the absence of INDUSTRY data from SAPA. INDUSTRY TURNOVER The estimated turnover from the BROILER INDUSTRY is shown in Table 5. In the absence of average day-old chick prices for 2017, the total turnover figure is not available. TABLE 5: Turnover of the BROILER INDUSTRY Year DOC INDUSTRY BROILER INDUSTRY Total Price (R/doc) Turnover (R million) Producer price (R/kg) Turnover (R million) Cull price (R/bird) Turnover (R million) Turnover (R million) 2016 4 29 34 2017 34 Change 4 % change DOC = day-old chick SMALL-SCALE BROILER FARMERS These statistics summarise quarterly surveys conducted by Silverpath Consulting.
10 All prices exclude VAT. 1. Hatcheries From two to five hatcheries hatching day-old chicks, from three different provinces, responded to the quarterly surveys in 2017. The provinces were Gauteng, KwaZulu-Natal and Limpopo. On average one third of the hatcheries was owned by females, and two thirds by males. A total of million fertile eggs were produced for incubation in 2017. Eggs were also purchased, totalling 34 600 eggs this year, at a weighted average price of per fertile egg. This price increased by compared to 2016. 8 | P a g e The total number of BROILER chicks sold in 2017 was 877 700 at a weighted average selling price of per chick; a annual increase in price. The total value of the BROILER chick sales was million in 2017. The turnover dropped by compared to last year. 2. BROILER producers An average of 173 BROILER farmers (down from 209 in 2016), from all 9 provinces, responded to the survey in 2017.