Transcription of Cardiovascular Imaging Laboratory Transthoracic ...
1 Cardiovascular Imaging Laboratory Transthoracic Echocardiographic Study Report Name: Patient ID: Exam Date: Ht: in Wt: lb BSA: m2 Sonographer: DOB: Age: Yrs Gender: Study Location: Previous Study: Reading Physician: Primary Care Physician: Referring Physician: Copy To: Medications: Indications: Risk Factors and Assessment: Procedure: Sonographer Comments: Ejection fraction is %. Please modify this number if necessary. *These comments will remove from the final report. Observations Left Ventricle: Normal chamber size. Normal wall thickness. Normal global systolic function. Normal diastolic function. No resting wall motion abnormalities noted. Right Ventricle: Chamber size is normal. Global systolic function is normal. Left Atrium: Left atrium is normal in size. Right Atrium: Right atrium is normal in size.
2 Mitral Valve: Valve appears structurally normal. No evidence of stenosis. No significant regurgitation visualized. Aortic Valve: Valve appears structurally normal. No evidence of stenosis. No significant regurgitation visualized. Tricuspid Valve: Valve appears structurally normal. No evidence of stenosis. No significant regurgitation visualized. Pulmonic Valve: Valve appears structurally normal. No evidence of stenosis. No significant regurgitation visualized. Pericardium: Pericardium appears normal. There is no pericardial effusion visualized. Aorta: Aortic root is normal in size. Pressures: Pulmonary artery systolic pressure is normal. Venous: The inferior vena cava is not dilated and shows more than 50% respiratory variation. Other: There is no pleural effusion present. Conclusions Normal echocardiogram. Yes Electronically Signed Patient: Patient ID #: Exam Date: M-Mode Dimensions Adult Values Normal Range RVDd cm cm IVSd cm cm IVSs cm LVIDd cm cm LVIDs cm cm LVPWd cm cm LVPWs cm cm Ao Root Diam cm cm Ao Ascend Diam cm < cm Ao Cusp Sep cm cm LA Diameter cm cm % Fractional Short % 30 45% % EF M-Mode % EPSS cm cm 2D Dimensions Adult Values Normal Range RVDd cm cm IVSd cm cm IVSs cm LVIDd cm cm LVIDs cm cm LVPWd cm cm LVPWs cm cm Ao Root Diam cm cm Ao Ascend Diam cm < cm Ao Cusp Sep cm cm LA Diameter cm cm LA Area (ESV A4C) cm2 LA Area (EDV A4C)
3 Cm2 % FS % 30 45% % EF 2D % 50 85% EPSS cm cm Simpson s Values Adult Values Normal Range LVEDV-4ch ml 56 155 ml LVESV-4ch ml 19 58 ml %EF 4ch % 55 85% LVEDV-2ch ml 56 155 ml LVESV-2ch ml 19 58 ml %EF 2 ch % 55 85% % EF Simpson s % 50 85% Stroke Vol (BP) ml Cardiac Output ml/min Stroke Index (A4C) ml/m2 Stroke Index (A2C) ml/m2 Other Values Adult Values Normal Range Heart Rate bpm LVOT Diam cm RVOT Diam cm RVOT VTI cm IVRT msec LV Mass g LV Mass Index g/m2 LA Volume ml LA Volume Index ml/m2 Qp:Qs Doppler Measurements Adult Values Normal Range Mitral Valve Peak Velocity m/s Mean Velocity m/s Peak PG mmHg Mean PG mmHg MV VTI cm MVA cm2 cm2 Press Half Time msec Decel Slope cm/s2 Decel Time msec 160 240 msec Peak E m/s m/s Peak A m/s m/s E to A Ratio E' Medial m/s E' Lateral m/s E / E' Medial E / E' Lateral ERO mm2 PISA Rad cm MR VTI cm Aliasing Vel cm/s MR Vmax m/s MR Flow ml/s MR Vol ml MR PISA cm2 Tricuspid Peak Velocity m/s m/s Mean Velocity m/s Peak PG mmHg Mean PG mmHg RA Pressure mmHg RVSP mmHg Pulmonary Peak PG mmHg Mean PG mmHg Velocity m/s m/s PAT msec LVOT Peak Velocity m/s m/s
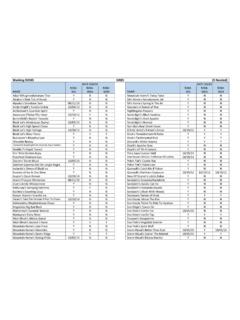
4 Mean Velocity m/s LV Peak PG mmHg LV Mean PG mmHg LV VTI cm Aortic Valve Peak Velocity m/s m/s Mean Velocity m/s Peak PG mmHg <10 mmHg Mean PG mmHg <10 mmHg AVA cm2 cm2 Ao VTI cm Press Half Time msec Resting Wall Motion Rest Score: 1 Normal 2 Hypokinetic 1 Hyperkinetic 3 Akinetic 4 Dyskinetic 5 Dilated and Thinned X Not Visualized 1 Normal 2 Hypokinetic 1 Hyperkinetic 3 Akinetic 4 Dyskinetic 5 Dilated and Thinned X Not Visualized 1 Normal 2 Hypokinetic 1 Hyperkinetic 3 Akinetic 4 Dyskinetic 5 Dilated and Thinned X Not Visualized 1 Normal 2 Hypokinetic 1 Hyperkinetic 3 Akinetic 4 Dyskinetic 5 Dilated and Thinned X Not Visualized